
Page 61 - JSOM Winter 2018
P. 61
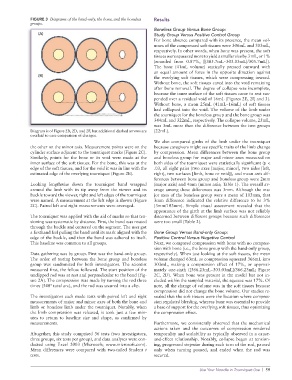
FIGURE 3  Diagrams of the band-only, the bone, and the boneless   Results
              groups.
                                                                 Boneless Group Versus Bone Group:
                 (A)                                             Study Group Versus Positive Control Group
                                                                 For bone absence compared with its presence, the mean vol-
                                                                 umes of the compressed soft tissues were 306mL and 303mL,
                                                                 respectively. In other words, when bone was present, the soft
                                                                 tissues were squeezed more to yield a smaller size by 3 mL, or 1%
                                                                 (rounded from 0.87%, [{305.7mL−303.03mL}/305.7mL]).
                                                                 The bone (41mL volume) statically pressed outward with
                                                                 an equal amount of force in the opposite direction against
                 (B)
                                                                 the overlying soft tissues, which were compressing inward.
                                                                 Without bone, the soft tissues caved into the void remaining
                                                                 after bone removal. The degree of collapse was incomplete,
                                                                 because the inner surface of the soft tissues came to rest sus-
                                                                 pended over a residual void of 16mL (Figures 2E, 2F, and 3).
                                                                 Without bone, a mean 25mL (41mL−16mL) of soft tissues
                                                                 had collapsed into the void. The volume of the limb under
                                                                 the tourniquet for the boneless group and the bone group was
                                                                 344mL and 322mL, respectively. The collapse volume, 25mL,
                                                                 was 3mL more than the difference between the two groups
              Diagram is of Figure 2B, 2D, and 2F, but additional dashed arrows are   (22mL).
              overlaid to ease comparison of changes.
                                                                 We also compared girths of the limb under the tourniquet
              the other on the minor axis. Measurement points were on the   because caregivers might see specific traits of the limb change
              cylinder surface adjacent to the tourniquet marks (Figure 2C).   by  compression. Mean  differences  between  the  bone group
              Similarly, points for the bone or its void were made at the   and boneless group for major and minor axes measured on
              inner surface of the soft tissues. For the bone, this was at the   both sides of the tourniquet were statistically significant (p <
              edge of the soft tissues, and for the void it was in line with the   .03, all eight pairs (two axes [major, minor], two sides [left,
              estimated edge of the overlying tourniquet (Figure 2E).  right], two surfaces [limb, bone or void]), and mean axis dif-
                                                                 ferences between bone group and boneless group were 2mm
              Looking  lengthwise  down  the  tourniquet  band  wrapped   (major axis) and 4mm (minor axis; Table 1). The overall av-
              around the limb with its tip away from the viewer and its   erage among these differences was 3mm. Although the ma-
              buckle toward the viewer, right and left edges of the tourniquet   jor axes of the boneless group were a mean of 103mm, that
              were named. A measurement at the left edge is shown (Figure   3mm  difference  indicated  the  relative  difference  to  be  3%
              2C). Paired left and right measurements were averaged.  (3mm/103mm). Simple visual assessment revealed that the
                                                                 appearance of the girth at the limb surface was not reliably
              The tourniquet was applied with the aid of marks so that ten-  discerned between different groups because such differences
              sioning was systematic by distance. First, the band was routed   were too small (Table 2).
              through the buckle and centered on the segment. The user got
              a firsthand feel pulling the band until its mark aligned with the   Bone Group Versus Band-only Group:
              edge of the buckle, and then the band was adhered to itself.   Positive Control Versus Negative Control
              This baseline was common to all groups.            Next, we compared compression with bone with no compres-
                                                                 sion with bone (i.e., the bone group with the band-only group,
              Data gathering was by group. First was the band-only group.   respectively). When just looking at the soft tissues, the mean
              The order of testing between the bone group and boneless   volume changed 63mL as compression squeezed 366mL into
              group was randomized for both investigators. The scientist   303mL, making a compression effect of 17%, or approxi-
              measured first, the fellow followed. The start position of the   mately one-sixth ([366.23mL−303.03mL]/366.23mL; Figure
              unclipped rod was at rest and perpendicular to the band (Fig-  2C, 2D). When bone was present in the model but not in-
              ure 2A). The compression was made by turning the rod three   cluded within the sampled material, the squeeze was 17%. Of
              times (540° total arc), and the rod was secured into a clip.  note, all the change of volume was in the soft tissues because
                                                                 compression did not change the bone volume. Our studies re-
              The investigators each made tests with paired left and right   vealed that the soft tissues were the location where compres-
              measurements of major and minor axes of both the bone and   sion regulated bleeding, whereas bone was essential to provide
              limb or  boneless limb under  the tourniquet.  Notably, when   a base of support for the overlying soft tissues, thus optimizing
              the limb compression was released, it took just a few min-  the compression effect.
              utes to return to baseline size and shape, as confirmed by
              measurements.                                      Furthermore, we consistently observed that the mechanical
                                                                 actions taken and  the outcomes of compression  rendered
              Altogether, this study comprised 36 tests (two investigators,   temporality and scalability as typically observed in a cause-
              three groups, six tests per group), and data analyses were con-  and-effect relationship. Notably, collapse began at tension-
              ducted using Excel 2003 (Microsoft;  www.microsoft.com).   ing, progressed stepwise during each turn of the rod, paused
              Mean differences  were compared  with  two-tailed Student  t   only when turning paused, and ended when the rod was
              tests.                                             secured.

                                                                                   Use Your Noodle in Tourniquet Use  |  59