
Page 22 - JSOM Winter 2018
P. 22
were performed with the Microsoft Excel software package FIGURE 2 Decompression failure by device.
(Micro soft Corp, www.microsoft.com). Statistical analysis
was performed using the STATA, version 13, statistical soft-
ware package (StataCorp).
Results
A total of 196 t-H/PTX events were induced in 25 swine, and
these were evenly distributed across the four devices studied.
One animal failed to recover and died prematurely during
the experiment, without intervention. A total of 100 events
were performed with 10% EBV hemorrhage and HTX, and
96 events were performed with 20% EBV hemorrhage and
HTX. Assumption of normality of distribution was rejected
with respect to continuous outcomes of interest, seconds to in-
tervention (p = .000), seconds to rescue (p = .000), and volume
of CO instilled (p = .000). AC, angiocatheter; LT, laparoscopic trocar; mVN, modified Veress
2 needle.
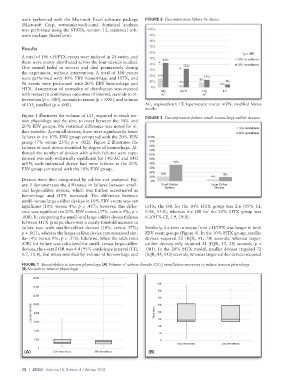
Figure 1 illustrates the volume of CO required to reach ten-
2
sion physiology and the time to onset between the 10% and FIGURE 3 Decompression failure: small- versus large-caliber devices.
20% EBV groups. No statistical difference was noted for ei-
ther variable. Across all devices, there were significantly fewer
failures in the 10% EBV group compared with the 20% EBV
group (7% versus 23%; p = .002). Figure 2 illustrates the
failures of each device stratified by degree of hemorrhage. Al-
though the number of devices with which failures were expe-
rienced was only statistically significant for 14G AC and 14G
mVN, each individual device had more failures in the 20%
EBV group compared with the 10% EBV group.
Devices were then categorized by caliber and analyzed. Fig-
ure 3 demonstrates the difference in failures between small-
and large-caliber devices, which was further accentuated as
hemorrhage and HTX increased. The difference between
small- versus large-caliber devices in 10% EBV events was not
significant (10% versus 4%; p = .437); however, this differ- HTX, the OR for the 10% HTX group was 2.6 (95% CI,
ence was significant in 20% EBV events (37% versus 9%; p = 0.48, 13.8), whereas the OR for the 20% HTX group was
.008). In comparing the small- and large-caliber device failures 6.1(95% CI, 1.9, 19.8).
between HTX groups, there was a nearly fourfold increase in
failure rate with smaller-caliber devices (10% versus 37%; Similarly, the time to rescue from t-H/TPX was longer in both
p = .001), whereas the larger-caliber device rate remained sim- EBV event groups (Figure 4). In the 10% HTX group, smaller
ilar (4% versus 9%; p = .370). Likewise, when the odds ratio devices required 52 (IQR, 41, 78) seconds, whereas larger-
(OR) for failure was calculated for small- versus large-caliber caliber devices only required 21 (IQR, 15, 28) seconds (p <
devices, the overall OR was 4.4 (95% confidence interval [CI], .001). In the 20% HTX model, smaller devices required 72
1.7, 11.4), but when stratified by volume of hemorrhage and (IQR, 45, 142) seconds, whereas larger-caliber devices required
FIGURE 1 Susceptibility to tension physiology. (A) Volume of carbon dioxide (CO ) insufflation necessary to induce tension physiology.
2
(B) Seconds to tension physiology.
(A) (B)
20 | JSOM Volume 18, Edition 4 / Winter 2018