
Page 110 - JSOM Winter 2018
P. 110
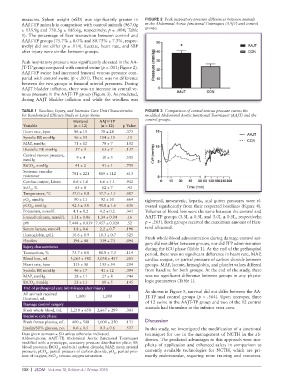
measures. Spleen weight (±SD) was significantly greater in   FIGURE 2  Peak inspiratory pressure differences between animals
          AAJT-TP animals in comparison with control animals (967.0g   in the Abdominal Aortic Junctional Tourniquet (AAJT) and control
          ± 135.9g and 750.5g ± 185.6g, respectively; p = .004; Table   groups.
          1). The percentage of liver transection between control and
          AAJT-TP groups (75.7% ± 8.0% and 80.73% ± 7.3%, respec-
          tively) did not differ (p = .114). Lactate, heart rate, and SBP
          after injury were similar between groups.

          Peak inspiratory pressure was significantly elevated in the AA-
          JT-TP group compared with control swine (p < .001; Figure 2).
          AAJT-TP swine had increased femoral venous pressure com-
          pared with control swine (p < .001). There was no difference
          between the two groups in femoral arterial pressures. During
          AAJT bladder inflation, there was an increase in central ve-
          nous pressure in the AAJT-TP group (Figure 3). As predicted,
          during AAJT bladder inflation and while the windlass was

          TABLE 1  Baseline, Injury, and Intensive Care Unit Characteristics   FIGURE 3  Comparison of central venous pressure curves the
          for Randomized Efficacy Study in Large Swine       modified Abdominal Aortic Junctional Tourniquet (AAJT) and the
                               Hextend    AAJT-TP            control groups.
           Variable             (n = 12)   (n = 12)  p Value
           Heart rate, bpm      86 ± 15    78 ± 28   .373
           Systolic BP, mmHg    96 ± 15   104 ± 10   .11
           MAP, mmHg            71 ± 12    78 ± 7    .102
           Diastolic BP, mmHg   57 ± 9     63 ± 7    .137
           Central venous pressure,   9 ± 4  10 ± 3  .505
           mmHg
           EtCO , mmHg          41 ± 2     41 ± 1    .759
               2
           Systemic vascular
           resistance          781 ± 221  819 ± 112  .613
           Cardiac output, L/min  6.6 ± 1.6  6.6 ± 1.1  .942
           SvO , %              65 ± 8     62 ± 7    .43
              2
           Temperature, °C     37.0 ± 0.8  37.7 ± 1.1  .087
           pO , mmHg            90 ± 11    92 ± 10   .664    tightened, mesenteric, hepatic, and gutter pressures were el-
             2
           pCO , mmHg          42.3 ± 3.0  41.8 ± 1.6  .636  evated significantly from their respected baselines (Figure 4).
              2
           Potassium, mmol/L   4.1 ± 0.2  4.2 ± 0.2  .341    Volumes of blood loss were the same between the control and
           Ionized calcium, mmol/L  1.31 ± 0.06  1.34 ± 0.04  .16  AAJT-TP groups (3.3L ± 0.5L and 3.0L ± 0.5L, respectively;
           pH                7.448 ± 0.039 7.457 ± 0.020  .52  p = .285). Both groups received the maximum amount of Hex-
           Serum lactate, mmol/L  1.8 ± 0.6  2.2 ± 0.7  .198  tend allocated.
           Hemoglobin, g/dL    10.6 ± 0.9  10.3 ± 0.7  .525  Fresh whole-blood administration during damage control sur-
           Platelets           394 ± 80   339 ± 73   .094    gery did not differ between groups, nor did FFP administration
           Injury characteristics                            during the ICU phase (Table 1). At the end of the prehospital
           Transection, %      75.7 ± 8.0  80.9 ± 7.3  .114  period, there was no significant difference in heart rate, MAP,
           Blood loss, mL     3,263 ± 542  3,038 ± 457  .285  cardiac output, or partial pressure of carbon dioxide between
           Heart rate, bpm     113 ± 38   133 ± 34   .204    groups. MAP, lactate, hemoglobin, and platelet values differed
           Systolic BP, mmHg    46 ± 17    41 ± 12   .394    from baseline for both groups. At the end of the study, there
           MAP, mmHg            28 ± 11    27 ± 8    .744    was no significant difference between groups in any physio-
           EtCO , mmHg          23 ± 11    18 ± 5    .145    logic parameters (Table 1).
               2
           End of prehospital care (60 minutes after injury)
           All animals received   1,000    1,000      1      As shown in Figure 5, survival did not differ between the AA-
           Hextend, mL                                       JT-TP and control groups (p = .564). Upon necropsy, three
           Damage control surgery                            of 12 swine in the AAJT-TP group and two of the 12 control
                                                             animals had thrombus in the inferior vena cava.
           Fresh whole blood, mL  2,218 ± 650  2,667 ± 289  .303
           Intensive care phase
           Fresh frozen plasma, mL  400 ± 548  1,000 ± 250  .131  Discussion
           Insulin/50% glucose, no.  0.6 ± 0.5  0.3 ± 0.6  .537  In this study, we investigated the modification of a junctional
          Data given as mean ± SD unless otherwise indicated.  tourniquet for use in the management of NCTH in the ab-
          Abbreviations: AAJT-TP, Abdominal Aortic Junctional Tourniquet   domen. The predicted advantages to this approach were sim-
          modified with a prototype, accessory pressure distribution plate; BP,   plicity of application and enhanced safety in comparison to
          blood pressure; EtCO , end-tidal carbon dioxide; MAP, mean arterial
                         2
          pressure; pCO , partial pressure of carbon dioxide, pO , partial pres-  currently available technologies for NCTH, which are pri-
                                                2
                    2
          sure of oxygen; SvO , venous oxygen saturation.    marily endovascular, requiring more training and resources.
                        2
          108  |  JSOM   Volume 18, Edition 4 / Winter 2018