
Page 46 - JSOM Summer 2018
P. 46
strength, and core strength. When given the opportunity to performed more unit agility training, unit CT, unit sprinting,
provide any additional written comments about the THOR3 unit resistance training, and exercise (both unit and personal)
program, 53% provided comments; 85% described THOR3 per week.
as very positive and beneficial.
Overall self-reported injury incidence was 51%. Self-reported
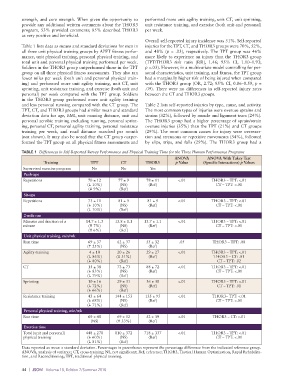
Table 1 lists data as means and standard deviations for men in injuries for the TPT, CT, and THOR3 groups were 70%, 52%,
all three unit physical training groups by APFT fitness perfor- and 48% (p = .03), respectively. The TPT group was 46%
mance, unit physical training, personal physical training, and more likely to experience an injury than the THOR3 group
total unit and personal physical training performed per week. (TPT/THOR3 risk ratio [RR], 1.46; 95% CI, 1.10–1.93;
Soldiers in the THOR3 group outperformed those in the TPT p =.03). However, in a multivariate model controlling for per-
group on all three physical fitness assessments. They also ran sonal characteristics, unit training, and fitness, the TPT group
fewer miles per week (both unit and personal physical train- had a marginally higher risk of being injured when compared
ing) and performed more unit agility training, unit CT, unit with the THOR3 group (OR, 2.72; 95% CI, 0.86–8.59, p =
sprinting, unit resistance training, and exercise (both unit and .09). There were no differences in self-reported injury rates
personal) per week compared with the TPT group. Soldiers between the CT and THOR3 groups.
in the THOR3 group performed more unit agility training
and less personal running compared with the CT group. The Table 2 lists self-reported injuries by type, cause, and activity.
TPT, CT, and THOR3 groups had similar mean and standard The most common types of injuries were overuse sprains and
deviation data for age, BMI, unit running distance, unit and strains (32%), followed by muscle and ligament tears (24%).
personal aerobic training excluding running, personal sprint- The THOR3 group had a higher percentage of sprain/strain
ing, personal CT, personal agility training, personal resistance overuse injuries (35%) than the TPT (21%) and CT groups
training per week, and road distance marched per month (29%). The most common causes for injury were overexer-
(not shown). It may also be noted that the CT group outper- tion and strenuous or repetitive movements (54%), followed
formed the TPT group on all physical fitness assessments and by slips, trips, and falls (29%). The THOR3 group had a
TABLE 1 Differences in Self-Reported Survey Performance and Physical Training Time for the Three Human Performance Programs
ANOVA ANOVA With Tukey Test
Training TPT CT THOR3 p Value (Specific Interactions) p Values
Supervised exercise program No No Yes
Push-ups
Repetitions 70 ± 12 77 ± 9 78 ± 11 <.01 THOR3 – TPT: <.01
( 10%) (NS) (Ref) CT – TPT: <.01
( 9%) (Ref)
Sit-ups
Repetitions 73 ± 11 81 ± 9 81 ± 9 <.01 THOR3 – TPT: <.01
( 10%) (NS) (Ref) CT – TPT: <.01
( 10%) (Ref)
2-mile run
Minutes and fraction of a 14.7 ± 1.3 13.8 ± 1.1 13.7 ± 1.1 <.01 THOR3 – TPT: <.01
minute ( 7%) (NS) (Ref) CT – TPT: <.01
( 6%) (Ref)
Unit physical training, min/wk
Run time 69 ± 37 62 ± 37 55 ± 32 .05 THOR3 – TPT: .08
( 25%) (NS) (Ref)
Agility training 4 ± 10 20 ± 26 29 ± 27 <.01 THOR3 – TPT: <.01
( 86%) ( 31%) (Ref) THOR3 – CT: .01
( 80%) (Ref) CT – TPT: .02
CT 15 ± 38 73 ± 73 88 ± 72 <.01 THOR3 – TPT: <.01
( 83%) (NS) (Ref) CT – TPT: <.01
( 79%) (Ref)
Sprinting 10 ± 16 29 ± 31 36 ± 30 <.01 THOR3 – TPT: <.01
( 72%) (NS) (Ref) CT – TPT: .01
( 66%) (Ref)
Resistance training 43 ± 64 144 ± 153 135 ± 95 <.01 THOR3– TPT: <.01
( 68%) (NS) (Ref) CT – TPT: <.01
( 71%) (Ref)
Personal physical training, min/wk
Run time 69 ± 48 69 ± 52 52 ± 39 <.01 THOR3 – CT: <.01
(NS) ( 33%) (Ref)
Exercise time
Total (unit and personal) 448 ± 278 810 ± 372 718 ± 337 <.01 THOR3 – TPT: <.01
physical training ( 60%) (NS) (Ref) CT – TPT: <.01
( 81%) (Ref)
Data reported as mean ± standard deviation. Percentages in parentheses represent the percentage difference from the indicated reference group.
ANOVA, analysis of variance; CT, cross-training; NS, not significant; Ref, reference; THOR3, Tactical Human Optimization, Rapid Rehabilita-
tion, and Reconditioning; TPT, traditional physical training.
44 | JSOM Volume 18, Edition 2/Summer 2018