
Page 41 - JSOM Summer 2018
P. 41
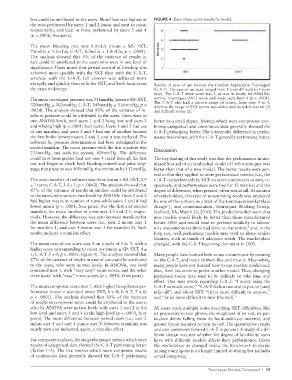
loss could be attributed to the users. Blood loss was highest in   FIGURE 4  Ease-of-use score results by model.
              the tests performed by users 1 and 2 (most and next to most,
              respectively), and least in those performed by users 3 and 4
              (p < .0006, five pairs).

              The mean bleeding rate was 8.0mL/s (mean ± SD: SXT,
              7.6mL/s ± 1.2mL/s; C-A-T, 8.5mL/s ± 1.0mL/s; p = .0001).
              The analysis showed that 5% of the variance of results in
              rate could be attributed to the users who were in one level of
              significance. Users noted that partial control of bleeding was
              achieved more quickly with the SXT than with the C-A-T,
              whereas with the C-A-T, full control was achieved more
              abruptly and quickly than with the SXT, and both facts cause   Results of ease of use favored the Combat Application Tourniquet
              the rates to diverge.                              (C-A-T). The ease-of-use scale ranged from 1 (very difficult) to 5 (very
                                                                 easy). The C-A-T mean score was 5, as was its mode; the SAM Ex-
              The mean tourniquet pressure was 331mmHg (mean ± SD: SXT,   tremity Tourniquet (SXT) mean and mode were both 4 (p < .0001).
              320mmHg ± 102mmHg; C-A-T, 343mmHg ± 116mmHg; p =   The C-A-T also had a narrow range of scores, from only 4 to 5,
                                                                 whereas the range of SXT scores was wider, and included neutral (3)
              .0024). The analysis showed that 85% of the variance of re-  and difficult scores (2).
              sults in pressure could be attributed to the users. Users were in
              two ANOVA levels, with users 1 and 2 being low and users 3   better by a small degree. Metrics which were composites com-
              and 4 being high (p < .0001, four pairs). Users 1 and 2 had use   bining categorical and continuous data generally showed the
              of one manikin, and users 3 and 4 had use of another because   C-A-T performing better. The intermodel difference in perfor-
              the first broke between users 2 and 3, and it was replaced. The   mance was robust, with the C-A-T generally performing better.
              software for pressure determination had been redesigned in the
              second manikin. The mean pressure with the first manikin was
              233mmHg, and with the second, 429mmHg. The difference   Discussion
              could have been greater had not user 4 raced through his first   The key finding of this study was that the performance in sim-
              test and forgot to check both bleeding control and pulse stop-  ulated first aid of an established model of limb tourniquet was
              page; that pressure was 101mmHg, the minimum by 112mmHg.  better than that of a new model. The better results were gen-
                                                                 eral in that they applied to more performance metrics (i.e., the
              The mean number of rod turns was three (mean ± SD: SXT, 2.9   C-A-T outperformed the SXT on seven parameters vs two, re-
              ± 1 turns; C-A-T, 3.1 ± 1; p = .0663). The analysis showed that   spectively, and performances were tied for 12 metrics) and the
              47% of the variance of results in number could be attributed   degree of difference, when present, often was small. At summit
              to the users, who were in two levels by ANOVA: Users 1 and 2   of stakeholders, this type of unsurprising result was predicted
              had higher means in number of turns while users 3 and 4 had   by one of the authors as a trait of the tourniquet marketplace
              lower means (p < .0001, four pairs). For the first and second   (Kragh J, oral communication, Tourniquet Working Group,
              manikin, the mean number of turns was 3.5 and 2.5, respec-  Stafford, VA, March 23, 2010). The predictions then were that
              tively. However, the difference was zero between manikins for   new models would likely be better than those manufactured
              the mean difference between users (i.e., user 2 minus user 1   before 2005 and would tend to perform similarly in labora-
              for manikin 1, and user 4 minus user 3 for manikin 2). Such   tory assessments (as three had done at that point),  and, in the
                                                                                                       9
              results indicate a manikin effect.                 long run, well-performing models may tend to share similar
                                                                 features, such as bands of adequate width. The marketplace
              The mean ease-of-use score was 4 on a scale of 1 to 5, with a   changed, with the C-A-T becoming dominant in 2005.
              higher score corresponding to easier use (mean ± SD: SXT, 4 ±
              1; C-A-T 5 ± 0; p < .0001; Figure 4). The analysis showed that   Many people have learned how to use a tourniquet by training
              27% of the variance of results in ease of use could be attributed   on the C-A-T, and many of them like and trust it. Meanwhile,
              to the users, who were in two levels. In ANOVA, one level   many people have not learned how to use another model and,
              contained user 1, with “very easy” mean scores, and the other   thus, have not come to prefer another model. Thus, changing
              three users’ with “easy” mean scores (p < .0018, three pairs).  preference  today may  tend to be  unlikely or take  time and
                                                                 effort. One user wrote regarding C-A-T: “I enjoy using the
              The mean composite score was 7, with higher being better per-  C-A-T so much more,” “C-A-T feels so natural to put on [and]
              formance (mean ± standard error: SXT, 6 ± 0; C-A-T, 7 ± 0;    take off”; and about SXT: “[it] is more difficult to remove,”
              p < .0001). The analysis showed that 30% of the variance   and “[it is] more difficult to turn [the rod].”
              of results in composite score could be attributed to the users,
              who by ANOVA were in two levels with users 1 and 2 in the   All users made multiple notes describing SXT difficulties, like
              low level and users 3 and 4 in the high level (p < .0003, four   its propensity to tear gloves, the roughness of its rod, its par-
              pairs). The mean difference between paired users (i.e., user 2   ticulate debris falling from its hook-and-loop material, and
              minus user 1 and user 4 minus user 3) between manikins was   greater forces required to turn its rod. The quantitative results
              nearly zero and indicated, again, a manikin effect.  and user comments favored C-A-T in general. A study of a dif-
                                                                 ferent design may test whether the degree of familiarity users
              For composite analyses, the six performance metrics which were   have with different models affects their performance. Given
              results of categorical data showed the C-A-T performing better   the marketplace as changed today, the benchmark to decide
              (Tables 1–3). The five metrics which were composite results   among tourniquets is no longer limited to testing but includes
              of  continuous data  generally  showed the  C-A-T  performing   actual caregiving.

                                                                                       Tourniquet Models Compared  |  39