
Page 53 - JSOM Spring 2018
P. 53
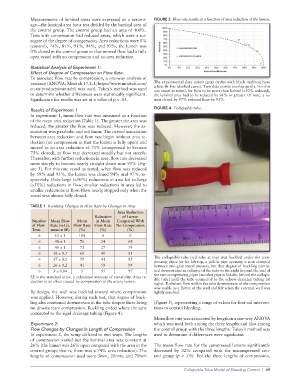
Measurements of luminal areas were expressed as a per cent-  FIGURE 3  Flow rate results as a function of area reduction of the lumen.
              age—the luminal area for a test divided by the luminal area of
              the control group. The control group had an area of 100%.
              Tests with compression had reduced areas, which were a sur-
              rogate of the degree of compression. Area reductions were 0%
              (control), 74%, 81%, 91%, 94%, and 97%; the lumen was
              0% closed in the control group in that normal flow had a fully
              open vessel with no compression and no area reduction.

              Statistical Analysis of Experiment 1:
              Effect of Degree of Compression on Flow Rate.
              To associate flow rate by compression, a one-way analysis of
              variance (ANOVA; Minitab 17.2.1; https://www.minitab.com/  The experimental data points (gray circles with black outlines) have
              en-us/products/minitab/) was used. Tukey’s method was used   a best-fit line (dashed curve). Two data points overlap partly. For this
                                                                 one vessel as tested, for flow to be more than halved (>50% reduced),
              to determine whether differences were statistically significant.   the luminal area had to be reduced by 94% or greater. Of note, a lu-
              Significance for results was set at a value of p < .05.  men closed by 97% reduced flow by 95%.
                                                                 FIGURE 4  Collapsible tube.
              Results of Experiment 1
              In experiment 1, mean flow rate was measured as a function
              of the mean area reduction (Table 1). The greater the area was
              reduced, the greater the flow was reduced. However, the as-
              sociation was parabolic and not linear. The curved association
              between area reduction and flow rate began without area re-
              duction (no compression in that the lumen is fully open) and
              moved to an area reduction of 75% (compressed to become
              75% closed), as flow rate decreased steadily but not steeply.
              Thereafter, with further reductions in area, flow rate decreased
              more steeply to become nearly straight down near 95% (Fig-
              ure 3). For this one vessel as tested, when flow was reduced
              by 59% and 95%, the lumen was closed 94% and 97%, re-
              spectively. Only large (>50%) reductions in area led to large
              (>50%) reductions in flow; smaller reductions in area led to
              smaller reductions in flow. Flow nearly stopped only when the
              vessel was almost fully closed.
              TABLE 1  Resulting Changes in Flow Rate by Changes in Area
                                                 Area Reduction
                                        Reduction   of Lumen
              Number  Mean Flow   Mean    in Mean   Compared With
              of Flow   Rate (mL/s,  Flow Rate  Flow Rate  No Compression
              Tests   mean ± SE)  (%)     (%)         (%)
                 6      63 ± 1    100      0          0
                 6      48 ± 1    76       24         68
                 6      46 ± 1    73       27         74
                 6     38 ± 0.3   60       40         81
                 6     37 ± 0.2   59       41         85         The collapsible tube (red tube at top) was buckled under the com-
                                                                 pressing pipes (at far left top, a yellow pipe opening is seen clamped
                 6     26 ± 0.2   41       59         94         between two gray metal presses), but that degree of buckling contin-
                 6     3 ± 0.04   5        95         97         ued downstream as collapse of the tube to the right beyond the end of
              SE is the standard error, a calculated measure of variability. Area re-  the two compressing pipes (another pipe is hidden behind the collaps-
                                                                 ible tube) until the tube connected to the yellow drainage tubing (at
              duction is an effect caused by compression of the artery lumen.
                                                                 right). Turbulent flow within the tube downstream of the compression
                                                                 was visible as a flutter of the wall and felt when the external wall was
              By design, the wall was buckled inward where compression   lightly touched.
              was applied. However, during each test, that degree of buck-
              ling also continued downstream in the tube despite there being   (Figure 5), representing a range of values for first-aid interven-
              no downstream compression. Buckling ended where the tube   tions to control bleeding.
              connected to the rigid drainage tubing (Figure 4).
                                                                 Mean flow rate was associated by length in a one-way ANOVA
              Experiment 2:                                      which was used both among the three lengths and also among
              Flow Changes by Changes in Length of Compression   the control group with the three lengths. Tukey’s method was
              In experiment 2, the setup differed in two ways. The lengths   used to determine if differences were significant.
              of compression varied but the luminal area was constant at
              26% (the lumen was 26% open compared with the area in the   The mean flow rate for the compressed lumens significantly
              control group; that is, there was a 74% area reduction). The   decreased by 32% compared with the uncompressed con-
              lengths of compression used were 5mm, 20mm, and 70mm   trol  group  (p  <  .05).  For  the  three  lengths  of  compression,

                                                                             Collapsible Tube Model of Bleeding Control  |  49