
Page 113 - JSOM Winter 2017
P. 113
comparisons when appropriate. Paired t tests were used to compared with the field phase of SERE, CQB, DB, and RS (p <
compare before and after ITC HEI scores. Significance was set .05). Dietary fat intake was highest during the academic phase
at p < .05 and data are presented as mean ± SD. Data were of SERE compared with the field phase of SERE, CQB, DB,
analyzed using SPSS Statistics for Windows, version 21.0 (IBM and RS (p < .05).
Corp., https://www.ibm.com/analytics/us/en/technology/spss/).
Dietary Patterns and HEI
Habitual total energy and macronutrient intake patterns, esti-
Results
mated using the FFQ, were not different before and after ITC
Energy Balance and Body Mass (p < .05). Before starting ITC, participants consumed 3,094 ±
TDEE was highest during RS compared with CQB, DB, and 759kcal/d, 128 ± 33g/d protein, 373 ± 96g/d carbohydrate, and
the field phase of SERE (p < .05; Table 2). EI was the lowest 120 ± 33g/d fat. During ITC, participants consumed 2,920 ±
during the field phase of SERE compared with CQB, DB, and 1,462kcal/d, 114 ± 52g/d protein, 348 ± 195g/d carbohydrate,
RS (p < .05). EB was more negative during the field phase and 114 ± 56g/d fat. Diet quality; however, declined during
of SERE and RS than during CQB and DB (p < .05). There ITC: HEI score after ITC was 7% lower than HEI score before
were no differences in TDEE between the academic (3,869 ± starting the 9-month training course (p < .05; Table 4). The
233kcal/d) and field (4,011 ± 475kcal/d) phases of SERE. EI change in HEI score during ITC was a result of lower intake
during SERE was higher during the academic phase (3,633 ± of greens and beans, dark green vegetable, and legumes, and
662kcal/d) versus field phase (346 ± 0.0kcal/d; p < .05). En- greater intakes of empty calories (i.e., calories from solid fat,
ergy balance during SERE was more negative during the field alcohol [outside of specific training phases, such as SERE, RS,
versus academic phase (p < .05). Total body mass was lost dur- DB, alcohol is not controlled or restricted during ITC]), and
ing SERE (−6.5% ± 2%), RS (−5.8% ± 2%), and DB (−1.8% added sugars; p <.05).
± 2%; p < 05), and maintained during CQB (−0.6% ± 2%; p
> .05; Figure 1). Overall, body mass at the end of ITC (86.7 ± Discussion
9.0kg) was not different from the start of ITC (86.4 ± 9.8kg;
p > .05). The primary findings from this study are that the field train-
ing phases of ITC resulted in negative energy balance due to
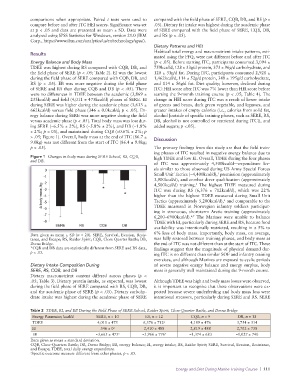
Figure 1 Changes in body mass during SERE School, RS, CQB, high TDEE and low EI. Overall, TDEE during the four phases
and DB.
of ITC was approximately 4,500kcal/d—expenditure lev-
els similar to those observed during US Army Special Forces
Small Unit Tactics (~4,400kcal/d), premission (approximately
1
3,900kcal/d), and combat diver qualification (approximately
4,500kcal/d) training. The highest TDEE measured during
4
ITC was during RS (6,376 ± 712kcal/d), which was 22%
higher than the highest TDEE measured during Small Unit
Tactics (approximately 5,200kcal/d), and comparable to the
1
TDEE measured in Norwegian infantry soldiers participat-
ing in strenuous, short-term Arctic training (approximately
6,200–6900kcal/d). The Marines were unable to balance
6,7
TDEE with EI, particularly during SERE and RS, because food
availability was intentionally restricted, resulting in a 5% to
6% loss of body mass. Importantly, body mass, on average,
Data given as mean ± SD (n = 20). SERE, Survival, Evasion, Resis-
tance, and Escape; RS, Raider Spirit; CQB, Close Quarter Battle; DB, was fully restored between training phases, and body mass at
Derna Bridge. the end of ITC was not different than at the start of ITC. These
*CQB and DB data are statistically different from SERE and RS data, findings suggest that the magnitude of physical demand dur-
p < .05.
ing ITC is no different than similar SOF and infantry training
exercises, and although Marines are exposed to cyclic periods
Dietary Intake Composition During of severe negative energy balance and energy surplus, body
SERE, RS, CQB, and DB mass is generally well maintained during the 9-month course.
Dietary macronutrient content differed across phases (p <
.05; Table 3). Dietary protein intake, as expected, was lowest Although TDEE was high and body mass losses were observed,
during the field phase of SERE compared with RS, CQB, DB, it is important to recognize that these observations were ex-
and the academic phase of SERE (p < .05). Dietary carbohy- pected because severe underfeeding and body mass loss were
drate intake was highest during the academic phase of SERE intentional stressors, particularly during SERE and RS. SERE
Table 2 TDEE, EI, and EB During the Field Phase of SERE School, Raider Spirit, Close-Quarter Battle, and Derna Bridge
Energy Parameter, kcal/d SERE, n = 10 RS, n = 12 CQB, n = 9 DB, n = 13
TDEE 4,011 ± 475 6,376 ± 712 a 4,189 ± 476 3,754 ± 314
EI 346 ± 0 a 2,410 ± 488 2,819 ± 488 2,702 ± 738
EB −3,665 ± 475 a −3,966 ± 776 a −1,374 ± 683 −1,027 ± 740
Data given as mean ± standard deviation.
CQB, Close-Quarters Battle; DB, Derna Bridge; EB, energy balance; EI, energy intake; RS, Raider Spirit; SERE, Survival, Evasion, Resistance,
and Escape; TDEE, total daily energy expenditure.
a Specific outcome measure different from other phases, p < .05.
Energy and Diet During Marine Training Course | 111