
Page 71 - Journal of Special Operations Medicine - Winter 2016
P. 71
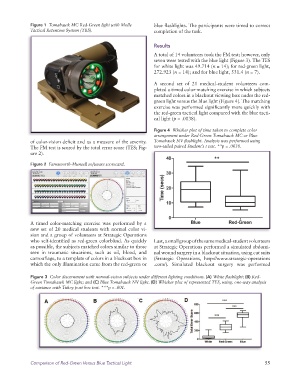
Figure 1  Tomahawk MC Red-Green light with Molle   blue flashlights. The participants were timed to correct
              Tactical Retention System (TRS).                   completion of the task.


                                                                 Results
                                                                 A total of 14 volunteers took the FM test; however, only
                                                                 seven were tested with the blue light (Figure 3). The TES
                                                                 for white light was 49.714 (n = 14); for red-green light,
                                                                 272.923 (n = 14); and for blue light, 531.4 (n = 7).

                                                                 A second set of 21 medical-student volunteers com-
                                                                 pleted a timed color-matching exercise in which subjects
                                                                 matched colors in a blackout viewing box under the red-
                                                                 green light versus the blue light (Figure 4). The matching
                                                                 exercise was performed significantly more quickly with
                                                                 the red-green tactical light compared with the blue tacti-
                                                                 cal light (p = .0038).

                                                                 Figure 4  Whisker plot of time taken to complete color
                                                                 arrangement under Red-Green Tomahawk MC or Blue
              of  color-vision deficit and as a measure of the severity.    Tomahawk NV flashlight. Analysis was performed using
              The FM test is scored by the total error score (TES; Fig-  two-tailed paired Student’s t test. **p = .0038.
              ure 2).

              Figure 2  Farnsworth-Munsell software scorecard.


              A timed color-matching exercise was performed by a
              new set of 20 medical students with normal color vi-
              sion and a group of volunteers at Strategic Operations
              who self-identified as red-green colorblind. As quickly   Last, a small group of the same medical-student volunteers
              as possible, the subjects matched colors similar to those   at Strategic Operations performed a simulated abdomi-
              seen in traumatic situations, such as oil, blood, and   nal wound surgery in a blackout situation, using cut suits
              camouflage, to a template of colors in a blackout box in   (Strategic Operations, http://www.strategic-operations
              which the only illumination came from the red-green or   .com/). Simulated blackout surgery was performed


              Figure 3  Color discernment with normal-vision subjects under different lighting conditions. (A) White flashlight; (B) Red-
              Green Tomahawk MC light; and (C) Blue Tomahawk NV light. (D) Whisker plot of represented TES, using. one-way analysis
              of variance with Tukey post hoc test. ***p < .001.


              Comparison of Red-Green Versus Blue Tactical Light                                              55