
Page 61 - Journal of Special Operations Medicine - Winter 2016
P. 61
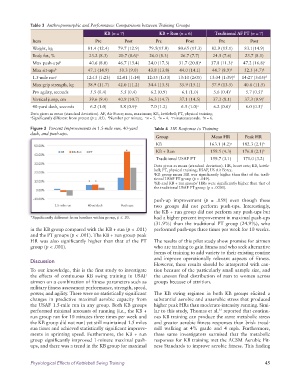
Table 3  Anthropomorphic and Performance Comparisons between Training Groups
                                            KB (n = 7)             KB + Run (n = 6)       Traditional AF PT (n = 7)
              Item                      Pre         Post         Pre          Post         Pre          Post
              Weight, kg             81.4 (12.4)  79.7 (12.9)  79.5(15.0)  80.65 (15.3)  82.9 (15.1)  83.1(14.9)
              Body fat, %             23.2 (8.3)  20.7 (8.6) a  26.0 (8.3)  26.7 (7.7)   24.5 (7.6)   23.7 (8.1)
              Max push-ups b          40.6 (8.0)  46.7 (13.4)  24.0 (17.3)  31.7 (20.8) a  37.8 (11.3) c  47.2 (16.8) c
              Max sit-ups b          47.1 (14.9)  50.3 (9.0)  43.8 (13.8)  44.0 (14.1)   44.7 (8.9) d  52.5 (4.7) d
              1.5-mile run e         12:13 (1:23)  12:01 (1:14)  12:55 (1:53)  13:10 (2:05)  13:34 (1:39) d  14:27 (3:05) d
              Max grip strength, kg  38.9 (11.7)  42.0 (11.2)  34.4 (13.5)  35.9 (15.1)  37.9 (13.5)  40.8 (11.5)
              Pro agility, seconds    5.5 (0.4)    5.5 (0.4)   6.2 (0.9)    6.1 (1.0)    5.6 (0.4) f  5.7 (0.5) f
              Vertical jump, cm       39.6 (9.4)  40.9 (10.7)  36.3 (14.7)  37.1 (14.5)  37.3 (8.1)   37.3 (9.9) f
              40-yard dash, seconds   6.2 (1.0)    5.8 (0.9) a  7.0 (1.2)   6.5 (1.0) a  6.2 (0.6) f  6.0 (0.5) f
              Data given as mean (standard deviation). AF, Air Force; max, maximum; KB, kettlebell; PT, physical training.
                                              b
              a Significantly different from pretest (p ≤ .05).   Number per minute.   n = 5.   n = 4.   minutes:seconds.   n = 6.
                                                             c
                                                                                     f
                                                                        e
                                                                  d
              Figure 2  Percent Improvements in 1.5-mile run, 40-yard   Table 4  HR Response to Training
              dash, and push-ups.
                                                                 Group                  Mean HR       Peak HR
                                                                 KB                     163.1 (4.2) a  182.3 (2.1) b
                                                                 KB + Run               159.5 (4.3)  176.8 (2.1) b
                                                                 Traditional USAF PT    159.7 (3.1)  171.0 (3.2)
                                                                 Data given as mean (standard deviation). HR, heart rate; KB, kettle-
                                                                 bell; PT, physical training; USAF, US Air Force.
                                                                 a KB group mean HR was significantly higher than that of the tradi-
                                                                 tional USAF PT group (p = .049).
                                                                 b KB and KB + run groups’ HRs were significantly higher than that of
                                                                 the traditional USAF PT group (p < .0001).

                                                                 push-up improvement (p = .058) even though these
                                                                 two groups did not perform push-ups. Interestingly,
                                                                 the KB + run group did not perform any push-ups but
              *Significantly different from baseline within group, p ≤ .05.   had a higher percent improvement in maximal push-ups
                                                                 (31.9%) than the traditional PT group (24.9%), who
              in the KB group compared with the KB + run (p < .001)   performed push-ups three times per week for 10 weeks.
              and the PT groups (p < .001). The KB + run group peak
              HR was also significantly higher than that of the PT   The results of this pilot study show promise for airmen
              group (p < .001).                                  who are training to gain fitness and who seek alternative
                                                                 forms of training to add variety to their existing routine
                                                                 and  improve operationally  relevant  aspects of  fitness.
              Discussion
                                                                 However, these results should be interpreted with cau-
              To our knowledge, this is the first study to investigate   tion because of the particularly small sample size, and
              the effects of continuous KB swing training in USAF   the uneven final distribution of men to women across
                airmen on a combination of fitness parameters such as   groups because of attrition.
              military fitness assessment performance, strength, speed,
              power, and agility. There were no statistically significant   The  KB swing regimen  in  both KB groups  elicited  a
              changes in predictive maximal aerobic capacity from   substantial aerobic and anaerobic stress that produced
              the USAF 1.5-mile run in any group. Both KB groups   higher peak HRs than moderate-intensity running. Simi-
              performed minimal amounts of running (i.e., the KB +   lar to this study, Thomas et al.  reported that continu-
                                                                                           12
              run group ran for 10 minutes three times per week and   ous KB training can produce the same metabolic stress
              the KB group did not run) yet still maintained 1.5 miles   and greater aerobic fitness responses than brisk tread-
              run times and achieved statistically significant improve-  mill walking at 4% grade and 4 mph. Furthermore,
              ments in sprinting speed. Furthermore, the KB + run   these same investigators surmised that the metabolic
              group significantly improved 1-minute maximal push-  responses for KB training met the ACSM Aerobic Fit-
              ups, and there was a trend in the KB group for  maximal   ness Standards to improve aerobic fitness. This finding


              Physiological Effects of Kettlebell Swing Training                                              45