
Page 38 - Journal of Special Operations Medicine - Summer 2016
P. 38
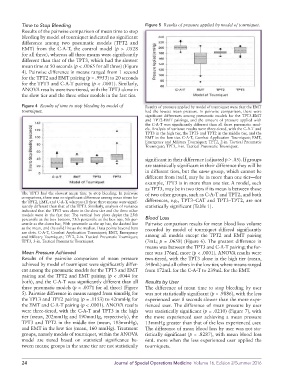
Time to Stop Bleeding                              Figure 5  Results of pressure applied by model of tourniquet.
          Results of the pairwise comparison of mean time to stop
          bleeding by model of tourniquet indicated no significant
          difference  among  two  pneumatic  models  (TPT2  and
          EMT)  from the  C-A-T, the  control model  (p >  .0528
          for all three), whereas all three means were significantly
          different than that of the TPT3, which had the slowest
          mean time at 50 seconds (p < .0065 for all three) (Figure
          4). Pairwise difference in means ranged from 1 second
          for the TPT2 and EMT pairing (p = .9953) to 20 seconds
          for the TPT3 and C-A-T pairing (p < .0001). Similarly,
          ANOVA results were two-tiered, with the TPT3 alone in
          the slow tier and the three other models in the fast tier.
          Figure 4  Results of time to stop bleeding by model of   Results of pressure applied by model of tourniquet were that the EMT
          tourniquet.                                        had the lowest mean pressure. In pairwise comparison, there were
                                                             significant differences among pneumatic models for the TPT3-EMT
                                                             and TPT2-EMT pairings, and the amount of pressure applied with
                                                             the C-A-T was significantly different than all three pneumatic mod-
                                                             els. Analysis of variance results were three-tiered, with the C-A-T and
                                                             TPT3 in the high tier, the TPT3 and TPT2 in the middle tier, and the
                                                             EMT in the low tier. C-A-T, Combat Application Tourniquet; EMT,
                                                             Emergency and Military Tourniquet; TPT2, 2-in. Tactical Pneumatic
                                                             Tourniquet; TPT3, 3-in. Tactical Pneumatic Tourniquet.

                                                               significant in their difference (adjusted p ≥ .05). If groups
                                                             are statistically significant in their difference they will be
                                                             in different tiers, but the same group, which cannot be
                                                             different from itself, may be in more than one tier—for
                                                             example, TPT3 is in more than one tier. A model, such
                                                             as TPT3, may be in two tiers if its mean is between those
          The TPT3 had the slowest mean time to stop bleeding. In pairwise   of two other groups, such as C-A-T and TPT2, and both
          comparison, there was no significant difference among mean times for
          the TPT2, EMT, and C-A-T, whereas all these three means were signif-  differences, e.g., TPT3–CAT and TPT3–TPT2, are not
          icantly different than that of the TPT3. Similarly, analysis of variance   statistically significant (Table 1).
          indicated that the TPT3 was alone in the slow tier and the three other
          models were in the fast tier. The vertical box plots depict the 25th
          percentile as the box bottom, 75th percentile as the box top, 5th per-  Blood Loss
          centile as the down bar, 95th percentile as the up bar, the dashed line   Pairwise comparison results for mean blood loss volume
          as the mean, and the solid line as the median. Data points beyond bars   recorded by model of tourniquet differed significantly
          are dots. C-A-T, Combat Application Tourniquet; EMT, Emergency
          and Military Tourniquet; TPT2, 2-in. Tactical Pneumatic Tourniquet;   among all models except the TPT2 and EMT pairing
          TPT3, 3-in. Tactical Pneumatic Tourniquet.         (7mL; p = .0658) (Figure 6). The greatest difference in
                                                             means was between the TPT3 and C-A-T pairing; the for-
          Mean Pressure Achieved                             mer was 176mL more (p < .0001). ANOVA results were
          Results  of  the  pairwise  comparison  of  mean  pressure   two-tiered, with the TPT3 alone in the high tier (mean,
          achieved by model of tourniquet were significantly differ-  348mL) and all others in the low tier, where means ranged
          ent among the pneumatic models for the TPT3 and EMT   from 172mL for the C-A-T to 239mL for the EMT.
          pairing and the TPT2 and EMT pairing (p < .0044 for
          both), and the C-A-T was significantly different than all   Results by User
          three pneumatic models (p < .0071 for all three) (Figure   The difference of mean time to stop bleeding by user
          5). Pairwise difference in means ranged from 6mmHg for   was not statistically significant (p = .9886), with the less
          the TPT3 and TPT2 pairing (p = .1153) to 42mmHg for   experienced user 8 seconds slower than the more expe-
          the EMT and C-A-T pairing (p < .0001). ANOVA results   rienced user. The difference of mean pressure by user
          were three-tiered, with the C-A-T and TPT3 in the high   was statistically significant (p = .0210) (Figure 7), with
          tier (mean, 202mmHg and 190mmHg, respectively), the   the more experienced user achieving a mean pressure
          TPT3 and TPT2 in the middle tier (mean, 183mmHg),   13mmHg greater than that of the less experienced user.
          and EMT in the low tier (mean, 160 mmHg). Treatment   The difference of mean blood loss by user was not sta-
          groups, namely models of tourniquet, within the ANOVA   tistically significant (p = .8287), with mean blood loss
          model are  tiered based on statistical significance be-  6mL more when the less experienced user applied the
          tween means; groups in the same tier are not statistically   tourniquets.


          24                                    Journal of Special Operations Medicine  Volume 16, Edition 2/Summer 2016