
Page 28 - Journal of Special Operations Medicine - Summer 2016
P. 28
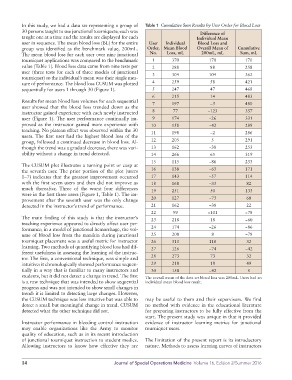
In this study, we had a data set representing a group of   Table 1  Cumulative Sum Results by User Order for Blood Loss
          30 persons taught to use junctional tourniquets; each was                 Difference of
          taught one at a time and the results are displayed for each             Individual Mean
          user in sequence. The mean blood loss (BL) for the entire   User   Individual   Blood Loss and
          group was identified as the benchmark value, 200mL.   Order,  Mean Blood   Overall Mean of   Cumulative
          The mean blood loss for each user over nine junctional   No.  Loss, mL    200mL, mL       Sum, mL
          tourniquet applications was compared to the benchmark   1     370            170            170
          value (Table 1). Blood loss data came from nine tests per   2  288            88            258
          user (three tests for each of three models of junctional   3  304            104            362
          tourniquet) so the individual’s mean was their single mea-
          sure of performance. The blood loss CUSUM was plotted   4     259             58            421
          sequentially for users 1 through 30 (Figure 1).       5       247             47            468
                                                                6       215             14            483
          Results for mean blood loss volumes for each sequential   7   197             −3            480
          user showed that the blood loss trended down as the
          instructor gained experience with each newly instructed   8   77             −123           357
          user (Figure 1). The user performance continually im-  9      174            −26            331
          proved  as  the  instructor  gained  more  experience  with   10  158        −42            289
          teaching. No plateau effect was observed within the 30   11   198             −2            286
          users. The first user had the highest blood loss of the
          group, followed a continued decrease in blood loss. Al-  12   205             5             291
          though the trend was a gradual decrease, there was vari-  13  162            −38            253
          ability without a change in trend detected.          14       266             65            319
                                                               15       115            −86            233
          The CUSUM plot illustrates a turning point or cusp at
          the seventh user. The prior portion of the plot (users   16   138            −63            171
          1–7) indicates that the greatest improvement occurred   17    143            −57            114
          with the first seven users and then did not improve as   18   168            −33             82
          much thereafter. Three of the worst four differences   19     251             50            133
          were in the first three users (Figure 1, Table 1). The im-
          provement after the seventh user was the only change   20     127            −73             60
          detected in the instructor’s trend of performance.   21       162            −38             22
                                                               22       99             −101           −78
          The main finding of  this  study is that the instructor’s   23  218           18            −60
          teaching experience appeared to directly affect user per-
          formance; in a model of junctional hemorrhage, the vol-  24   174            −26            −86
          ume of blood loss from the manikin during junctional   25     208             8             −78
          tourniquet placement was a useful metric for instructor   26  310            110             32
          learning. Two methods of quantifying blood loss had dif-  27  126            −74            −42
          ferent usefulness in assessing the learning of the instruc-
          tor. The first, a conventional technique, was simple and   28  273            73             32
          intuitive: it chronologically showed performance sequen-  29  218             18             49
          tially in a way that is familiar to many instructors and   30  158           −42             8
          students, but it did not detect a change in trend. The first   The overall mean of the data set blood loss was 200mL. Users had an
          is a raw technique that was intended to show sequential   individual mean blood loss result.
          progress and was not intended to show small changes in
          trend: it is limited to detecting large changes. However,
          the CUSUM technique was less intuitive but was able to   may be useful to them and their supervisors. We find
          detect a small but meaningful change in trend. CUSUM   no method with evidence in the educational literature
          detected what the other technique did not.         for preparing instructors to be fully effective from the
                                                             start. The present study was unique in that it provided
          Instructor performance in bleeding control instruction   evidence of instructor learning metrics for junctional
          may enable organizations like the Army to monitor   tourniquet users.
          quality of education, such as in its recent introduction
          of junctional tourniquet instruction to student medics.   The limitation of the present report is its introductory
          Allowing instructors to know how effective they are   nature. Methods to assess learning curves of instructors


          14                                    Journal of Special Operations Medicine  Volume 16, Edition 2/Summer 2016