
Page 29 - Journal of Special Operations Medicine - Summer 2016
P. 29
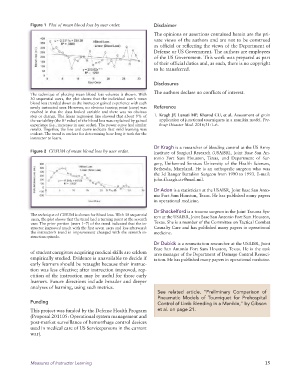
Figure 1  Plot of mean blood loss by user order.   Disclaimer
                                                                 The opinions or assertions contained herein are the pri-
                                                                 vate views of the authors and are not to be construed
                                                                 as official or reflecting the views of the Department of
                                                                 Defense or US Government. The authors are employees
                                                                 of the US Government. This work was prepared as part
                                                                 of their official duties and, as such, there is no copyright
                                                                 to be transferred.


                                                                 Disclosures

              The technique of plotting mean blood loss volumes is shown. With   The authors declare no conflicts of interest.
              30 sequential users, the plot shows that the individual user’s mean
              blood loss trended down as the instructor gained experience with each
              newly instructed user. However, no obvious turning point (cusp) was   Reference
              reached in that the data looked variable and there was no obvious
              step or change. The linear regression line showed that about 9% of   1.  Kragh JF, Lunati MP, Kharod CU, et al. Assessment of groin
              the variability (the R  value) of the blood loss was explained by gained   application of junctional tourniquets in a manikin model. Pre-
                            2
              experience (i.e., increases in user order). The power curve had similar   hosp Disaster Med. 2016;31:1–6.
              results. Together, the line and curve indicate that mild learning was
              evident. The trend is unclear for determining how long it took for the
              instructor to learn.
                                                                 Dr Kragh is a researcher of bleeding control at the US Army
              Figure 2  CUSUM of mean blood loss by user order.  Institute of Surgical Research (USAISR), Joint Base San An-
                                                                 tonio Fort Sam Houston, Texas, and Department of Sur-
                                                                 gery, Uniformed Services University of the Health Sciences,
                                                                 Bethesda, Maryland. He is an orthopedic surgeon who was
                                                                 the 3d Ranger Battalion Surgeon from 1990 to 1993. E-mail:
                                                                 john.f.kragh.civ@mail.mil.
                                                                 Dr Aden is a statistician at the USAISR, Joint Base San Anto-
                                                                 nio Fort Sam Houston, Texas. He has published many papers
                                                                 in operational medicine.

                                                                 Dr Shackelford is a trauma surgeon in the Joint Trauma Sys-
              The technique of CUSUM is shown for blood loss. With 30 sequential   tem at the USAISR, Joint Base San Antonio Fort Sam Houston,
              users, the plot shows that the trend had a turning point at the seventh
              user. The prior portion (users 1–7) of the trend indicated that the in-  Texas. She is a member of the Committee on Tactical Combat
              structor improved much with the first seven users and less afterward:   Casualty Care and has published many papers in operational
              the instructor’s trend in improvement changed with the seventh in-  medicine.
              struction episode.
                                                                 Dr Dubick is a resuscitation researcher at the USAISR, Joint
                                                                 Base San Antonio Fort Sam Houston, Texas. He is the task
              of student caregivers acquiring medical skills are seldom   area manager of the Department of Damage Control Resusci-
              empirically studied. Evidence is unavailable to decide if   tation. He has published many papers in operational medicine.
              early learners should be retaught because their instruc-
              tion was less effective; after instruction improved, rep-
              etition of the instruction may be useful for those early
              learners. Future directions include broader and deeper
              analyses of learning, using such metrics.
                                                                  See related article, “Preliminary Comparison of
                                                                  Pneumatic  Models of  Tourniquet  for Prehospital
              Funding                                             Control of Limb Bleeding in a Manikin,” by Gibson
              This project was funded by the Defense Health Program   et al. on page 21.
              (Proposal 201105: Operational system management and
              post-market surveillance of hemorrhage control devices
              used in medical care of US Servicepersons in the current
              war).


              Measures of Instructor Learning                                                                 15