
Page 83 - JSOM Spring 2026
P. 83
fNIRS ANOVA during the control condition (F=5.223; P=.014;
Cerebral hemodynamic activity of the PFC was monitored ηp =0.322), which indicated that baseline<task 1 (P=.016);
2
throughout each visit using two continuous-wave fNIRS however, there was no significant difference between base-
probes (PortaLite MkII, Artinis Medical Systems, Netherlands). line and task 2 (P=.051) or task 1 and task 2 (P=.699). For
A two-minute baseline measure was collected prior to the start NVG during the cognitive assessment, there was no signifi-
with participants at rest. Sensors were placed 2cm above each cant one-way repeated measures ANOVA (F=1.190; P=.309;
eyebrow (Figure 3) and secured with double-sided tape. Dis- ηp =0.098). There were significant pairwise comparisons be-
2
posable black elastic wrap (3M Corporation, St. Paul, MN) tween Conditions, which indicated control>NVG rScO during
2
was placed around the PortaLite sensors to secure the fNIRS task 1 (P=.014) and task 2 (P=.011). There was no significant
sensor and reduce external light contamination. Relative he- difference at baseline (P=.711) between the control and NVG
modynamic and cerebral metabolic rScO responses were mea- conditions for rScO .
2
2
sured using three LED light-emitting diodes and two detectors
per sensor, sampling at 25Hz. Each sensor recorded three long Cognitive Assessment Score
channels (inter-optode distances of 2.90, 3.50, and 4.10cm) For cognitive assessment scores, there was no significant condi-
and three short channels (inter-optode distances of 0.70, 0.80, tion × task number (F=0.184; P=.676, ηp =0.016). There was
2
and 0.74cm). A 0.14Hz low-pass filter removed physiological no main effect for condition (F=0.006; P=.941, ηp =0.001) or
2
artifacts prior to averaging the relative concentration across task number (F=0.061; P=.810, ηp =0.006).
2
each task. Data was visualized using Oxysoft software (ver-
sion 3.4, Artinis Medical Systems, Netherlands). Custom-built
LabVIEW programs were used to analyze the fNIRS-derived Marksmanship
hemodynamic responses (LabVIEW 2022, NI, Austin, TX). Cerebral Regional Oxygen Saturation
For rScO during the marksmanship tasks, there was a sig-
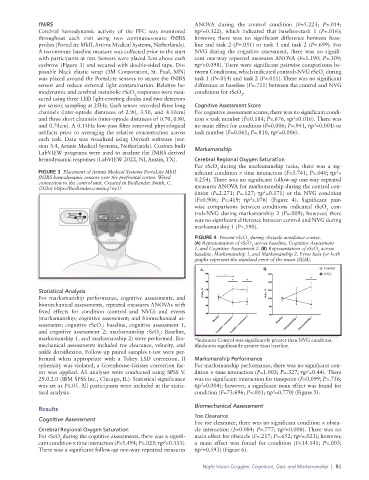
2
FIGURE 3 Placement of Artinis Medical Systems PortaLite MkII nificant condition × time interaction (F=3.741; P=.040; ηp =
2
fNIRS hemodynamic sensors over the prefrontal cortex. Wired 0.254). There was no significant follow-up one-way repeated
connection to the control unit. Created in BioRender. Smith, C. measures ANOVA for marksmanship during the control con-
(2026) https://BioRender.com/wq7vy35
dition (F=2.271; P=.127; ηp =0.171) or the NVG condition
2
(F=0.906; P=.419; ηp =.076) (Figure 4). Significant pair-
2
wise comparisons between conditions indicated rScO con-
2
trol>NVG during marksmanship 2 (P=.009); however, there
was no significant difference between control and NVG during
marksmanship 1 (P=.190).
FIGURE 4 Percent rScO during obstacle avoidance course.
2
(A) Representation of rScO across baseline, Cognitive Assessment
2
1, and Cognitive Assessment 2. (B) Representation of rScO across
2
baseline, Marksmanship 1, and Marksmanship 2. Error bars for both
graphs represent the standard error of the mean (SEM).
Statistical Analysis
For marksmanship performance, cognitive assessments, and
biomechanical assessments, repeated measures ANOVAs with
fixed effects for condition (control and NVG) and events
(marksmanship; cognitive assessment; and biomechanical as-
sessments; cognitive rScO : baseline, cognitive assessment 1,
2
and cognitive assessment 2; marksmanship rScO : Baseline,
2
marksmanship 1, and marksmanship 2) were performed. Bio- *Indicates Control was significantly greater than NVG condition.
mechanical assessments included toe clearance, velocity, and #Indicates significantly greater than baseline.
ankle dorsiflexion. Follow-up paired samples t-test were per-
formed when appropriate with a Tukey LSD correction. If Marksmanship Performance
sphericity was violated, a Greenhouse-Geisser correction fac- For marksmanship performance, there was no significant con-
tor was applied. All analyses were conducted using SPSS V. dition × time interaction (F=1.003; P=.327; ηp =0.44). There
2
29.0.2.0 (IBM SPSS Inc., Chicago, IL). Statistical significance was no significant interaction for timepoint (F=0.099; P=.756;
was set at P≤.05. All participants were included in the statis- ηp =0.004); however, a significant main effect was found for
2
tical analysis. condition (F=73.696; P<.001; ηp =0.770) (Figure 5).
2
Biomechanical Assessment
Results
Toe Clearance
Cognitive Assessment
For toe clearance, there was no significant condition × obsta-
2
Cerebral Regional Oxygen Saturation cle interaction (F=0.084; P=.777; ηp =0.008). There was no
For rScO during the cognitive assessments, there was a signifi- main effect for obstacle (F=.217; P=.652; ηp =.021); however,
2
2
cant condition × time interaction (F=5.494; P=.025; ηp =0.333). a main effect was found for condition (F=14.541; P=.003;
2
There was a significant follow-up one-way repeated measures ηp =0.593) (Figure 6).
2
Night Vision Goggles: Cognition, Gait, and Marksmanship | 81