
Page 65 - JSOM Summer 2024
P. 65
baseline (non-coagulopathic) cohort was 218,000 95% CI Hemoglobin within the baseline group was 13.5 (95% CI 13.3–
9
213,000–223,000) ×10 /L versus 117,000 (95% CI 110,000– 13.8) g/dL versus 11.0 (95% CI 10.7–11.4) g/dL within the co-
9
125,000) ×10 /L in the coagulopathic group (Table 1). agulopathic group. The coagulopathic cohort had a statistically
higher median ISS (5 vs. 14; p<.001). The frequency of injuries
involving the head and neck (9% vs. 17%; p=.001), thorax (8%
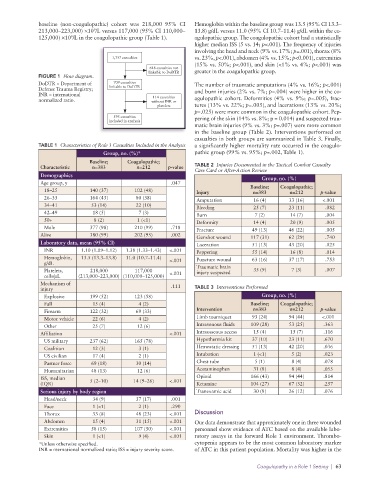
1,357 casualties vs. 23%, p<.001), abdomen (4% vs. 15%; p<0.001), extremities
(15% vs. 50%; p<.001), and skin (<1% vs. 4%; p<.001) was
648 casualties not
linkable to DoDTR greater in the coagulopathic group.
FIGURE 1 Flow diagram.
DoDTR = Department of 709 casualties The number of traumatic amputations (4% vs. 16%; p<.001)
Defense Trauma Registry; linkable to DoDTR and burn injuries (2% vs. 7%; p=.004) were higher in the co-
INR = international 114 casualties
normalized ratio. without INR or agulopathic cohort. Deformities (4% vs. 9%; p=.005), frac-
platelets tures (13% vs. 22%; p=.005), and lacerations (13% vs. 20%;
p=.025) were more common in the coagulopathic cohort. Pep-
595 casualties pering of the skin (14% vs. 8%; p = 0.014) and suspected trau-
included in analysis
matic brain injuries (9% vs. 3%; p=.007) were more common
in the baseline group (Table 2). Interventions performed on
casualties in both groups are summarized in Table 3. Finally,
TABLE 1 Characteristics of Role 1 Casualties Included in the Analysis a significantly higher mortality rate occurred in the coagulo-
Group, no. (%)* pathic group (99% vs. 95%; p=.002, Table 1).
Baseline; Coagulopathic;
Characteristic n=383 n=212 p-value TABLE 2 Injuries Documented in the Tactical Combat Casualty
Care Card or After-Action Review
Demographics Group, no. (%)
Age group, y .047
Baseline; Coagulopathic;
18–25 140 (37) 102 (48) Injury n=383 n=212 p-value
26–33 164 (43) 80 (38) Amputation 16 (4) 33 (16) <.001
34–41 53 (14) 22 (10)
Bleeding 25 (7) 23 (11) .082
42–49 18 (5) 7 (3)
Burn 7 (2) 14 (7) .004
50+ 8 (2) 1 (<1) Deformity 14 (4) 20 (9) .005
Male 377 (98) 210 (99) .718 Fracture 49 (13) 46 (22) .005
Alive 380 (99) 202 (95) .002 Gunshot wound 117 (31) 62 (29) .740
Laboratory data, mean (95% CI) Laceration 51 (13) 43 (20) .025
INR 1.10 (1.09–1.12) 1.38 (1.33–1.43) <.001 Peppering 55 (14) 16 (8) .014
Hemoglobin, 13.5 (13.3–13.8) 11.0 (10.7–11.4) Puncture wound 63 (16) 37 (17) .753
g/dL <.001
Platelets, 218,000 117,000 Traumatic brain 35 (9) 7 (3) .007
injury suspected
cells/μL (213,000–223,000) (110,000–125,000) <.001
Mechanism of .111
injury TABLE 3 Interventions Performed
Explosive 199 (52) 123 (58) Group, no. (%)
Fall 15 (4) 4 (2) Baseline; Coagulopathic;
Firearm 122 (32) 69 (33) Intervention n=383 n=212 p-value
Motor vehicle 22 (6) 4 (2) Limb tourniquet 93 (24) 94 (44) <.001
Other 25 (7) 12 (6) Intravenous fluids 109 (28) 53 (25) .363
Affiliation <.001 Intraosseous access 15 (4) 15 (7) .116
US military 237 (62) 165 (78) Hypothermia kit 37 (10) 23 (11) .670
Coalition 12 (3) 3 (1) Hemostatic dressing 51 (13) 42 (20) .036
US civilian 17 (4) 2 (1) Intubation 1 (<1) 5 (2) .023
Partner force 69 (18) 30 (14) Chest tube 5 (1) 8 (4) .078
Humanitarian 48 (13) 12 (6) Acetaminophen 31 (8) 8 (4) .055
ISS, median 5 (2–10) 14 (9–26) <.001 Opioid 166 (43) 94 (44) .814
(IQR) Ketamine 104 (27) 67 (32) .257
Serious injury by body region Tranexamic acid 30 (8) 26 (12) .076
Head/neck 34 (9) 37 (17) .001
Face 1 (<1) 2 (1) .290
Thorax 33 (8) 48 (23) <.001 Discussion
Abdomen 15 (4) 31 (15) <.001 Our data demonstrate that approximately one in three wounded
Extremities 58 (15) 107 (50) <.001 personnel show evidence of ATC based on the available labo-
Skin 1 (<1) 9 (4) <.001 ratory assays in the forward Role 1 environment. Thrombo-
*Unless otherwise specified. cytopenia appears to be the most common laboratory marker
INR = nternational normalized ratio; ISS = injury severity score. of ATC in this patient population. Mortality was higher in the
Coagulopathy in a Role 1 Setting | 63