
Page 49 - JSOM Summer 2024
P. 49
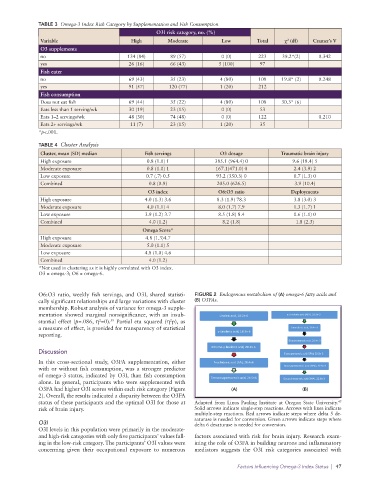
TABLE 3  Omega-3 Index Risk Category by Supplementation and Fish Consumption
                                                    O3I risk category, no. (%)
              Variable                      High        Moderate         Low         Total    χ  (df)  Cramer’s V
                                                                                               2
              O3 supplements
              no                           134 (84)      89 (57)         0 (0)       223     39.2*(2)    0.342
              yes                          26 (16)       66 (43)        5 (100)       97
              Fish eater
              no                           69 (43)       35 (23)         4 (80)      108     19.8* (2)   0.248
              yes                          91 (57)      120 (77)         1 (20)      212
              Fish consumption
              Does not eat fish            69 (44)       35 (22)         4 (80)      108     30.3* (6)
              Eats less than 1 serving/wk  30 (19)       23 (15)         0 (0)        53
              Eats 1–2 servings/wk         48 (30)       74 (48)         0 (0)       122                 0.210
              Eats 2+ servings/wk           11 (7)       23 (15)         1 (20)       35
              *p<.001.

              TABLE 4  Cluster Analysis
              Cluster, mean (SD) median         Fish servings            O3 dosage           Traumatic brain injury
              High exposure                      0.8 (1.0) 1           385.1 (964.4) 0           9.6 (18.4) 5
              Moderate exposure                  0.8 (1.0) 1           167.1(471.0) 0            2.4 (3.9) 2
              Low exposure                       0.7 (.7) 0.5           93.2 (350.3) 0           0.7 (1.3) 0
              Combined                            0.8 (0.9)             205.0 (626.5)            3.9 (10.4)
                                                 O3 index               O6:O3 ratio             Deployments
              High exposure                     4.0 (1.3) 3.6           8.3 (1.9) 78.3           3.8 (3.0) 3
              Moderate exposure                  4.0 (1.1) 4            8.0 (1.7) 7.9            1.3 (1.7) 1
              Low exposure                      3.9 (1.2) 3.7           8.5 (1.8) 8.4            0.6 (1.1) 0
              Combined                            4.0 (1.2)               8.2 (1.8)               1.8 (2.3)
                                                Omega Score*
              High exposure                      4.8 (1.3)4.7
              Moderate exposure                  5.0 (1.1) 5
              Low exposure                      4.8 (1.0) 4.6
              Combined                            4.0 (1.2)
              *Not used in clustering as it is highly correlated with O3 index.
              O3 = omega-3; O6 = omega-6.


              O6:O3 ratio, weekly fish servings, and O3I, shared statisti-  FIGURE 2  Endogenous metabolism of (A) omega-6 fatty acids and
              cally significant relationships and large variations with cluster   (B) O3FAs.
              membership. Robust analysis of variance for omega-3 supple-
              mentation  showed  marginal  nonsignificance,  with  an  insub-  Linoleic acid, 18:2n-6  α-Linolenic acid (ALA), 18:3n-3
                                 2
                                     39
              stantial effect (p=.086, η =0).  Partial eta squared (η p), as
                                                         2
              a measure of effect, is provided for transparency of statistical   γ-Linolenic acid, 18:3n-6  Stearidonic acid, 18:4n-3
              reporting.
                                                                                               Eicosatetranoic acid, 20:4n-3
                                                                      Dihomo-γ-linolenic acid, 20:3n-6
              Discussion                                                                      Eicosapentanoic acid (EPA), 20:5n-3
              In this cross-sectional  study, O3FA supplementation, either   Arachidonic acid (AA), 20:4n6
              with or without fish consumption, was a stronger predictor                      Docosapentaenoic acid (DPA), 22:5n-3
              of omega-3 status, indicated by O3I, than fish consumption   Tetracosapentaenoic acid, 24:5n6  Docosahexaenoic acid (DHA), 22:6n-3
              alone. In general, participants who were supplemented with
              O3FA had higher O3I scores within each risk category (Figure   (A)                    (B)
              2). Overall, the results indicated a disparity between the O3FA
              status of these participants and the optimal O3I for those at   Adapted  from  Linus  Pauling  Institute  at  Oregon  State  University.
                                                                                                                47
              risk of brain injury.                              Solid arrows indicate single-step reactions. Arrows with lines indicate
                                                                 multiple-step reactions. Red arrows indicate steps where delta 5 de-
                                                                 saturase is needed for conversion. Green arrows indicate steps where
              O3I                                                delta 6 desaturase is needed for conversion.
              O3I levels in this population were primarily in the moderate-
              and high-risk categories with only five participants’ values fall-  factors associated with risk for brain injury. Research exam-
              ing in the low-risk category. The participants’ O3I values were   ining the role of O3FA in building neurons and inflammatory
              concerning given their occupational exposure to numerous   mediators suggests the O3I risk categories associated with

                                                                               Factors Influencing Omega-3 Index Status  |  47