
Page 28 - JSOM Summer 2024
P. 28
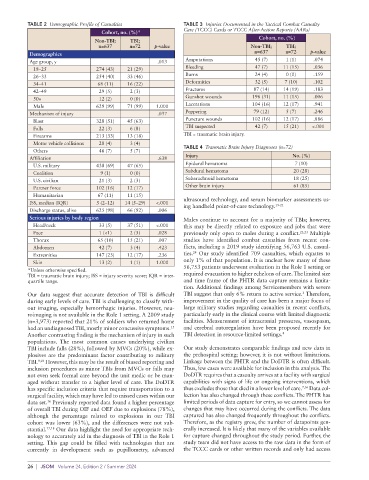
TABLE 2  Demographic Profile of Casualties         TABLE 3  Injuries Documented in the Tactical Combat Casualty
                                  Cohort, no. (%)*           Care (TCCC) Cards or TCCC After-Action Reports (AARs)
                                Non-TBI;    TBI;                                      Cohort, no. (%)
                                 n=637     n=72     p-value                        Non-TBI;    TBI;
           Demographics                                                             n=637     n=72    p-value
           Age group, y                              .013     Amputations           45 (7)    1 (1)    .074
            18–25               274 (43)   21 (29)            Bleeding              47 (7)    11 (15)  .036
            26–33               254 (40)   33 (46)            Burns                 24 (4)    0 (0)    .159
            34–41                68 (11)   16 (22)            Deformities           32 (5)    7 (10)   .102
            42–49                29 (5)     2 (3)             Fractures             87 (14)   14 (19)  .183
            50+                  12 (2)     0 (0)             Gunshot wounds       196 (31)   11 (15)  .006
            Male                629 (99)   71 (99)  1.000     Lacerations          104 (16)   12 (17)  .941
           Mechanism of injury                      .037      Peppering             79 (12)   5 (7)    .246
            Blast               328 (51)   45 (63)            Puncture wounds      102 (16)   12 (17)  .886
            Falls                22 (3)     6 (8)             TBI suspected         42 (7)    15 (21)  <.001
            Firearms            213 (33)   13 (18)           TBI = traumatic brain injury.
            Motor vehicle collisions  28 (4)  3 (4)          TABLE 4  Traumatic Brain Injury Diagnoses (n=72)
            Others               46 (7)     5 (7)
           Affiliation                              .638      Injury                             No. (%)
            U.S. military       438 (69)   47 (65)            Epidural hematoma                  7 (10)
            Coalition             9 (1)     0 (0)             Subdural hematoma                  20 (28)
                                                              Subarachnoid hematoma              18 (25)
            U.S. civilian        21 (3)     2 (3)
            Partner force       102 (16)   12 (17)            Other brain injury                 61 (85)
            Humanitarian         67 (11)   11 (15)
           ISS, median (IQR)     5 (2–12)  14 (5–29)  <.001  ultrasound technology, and serum biomarker assessments us-
                                                                                           19-21
                                                             ing handheld point-of-care technology.
           Discharge status, alive  625 (98)  66 (92)  .006
           Serious injuries by body region                   Males continue to account for a majority of TBIs; however,
            Head/neck            33 (5)    37 (51)  <.001    this may be directly related to exposure and jobs that were
            Face                 1 (<1)     2 (3)    .028    previously only open to males during a conflict. 22,23  Multiple
            Thorax               65 (10)   15 (21)   .007    studies have identified combat casualties from recent con-
            Abdomen              42 (7)     3 (4)    .423    flicts, including a 2019 study identifying 56,763 U.S. casual-
                                                                24
            Extremities         147 (23)   12 (17)   .236    ties.  Our study identified 709 casualties, which equates to
            Skin                 13 (2)     1 (1)   1.000    only 1% of that population. It is unclear how many of these
          *Unless otherwise specified.                       56,753 patients underwent evaluation in the Role 1 setting or
          TBI = traumatic brain injury; ISS = injury severity score; IQR = inter-  required evacuation to higher echelons of care. The limited size
          quartile range.                                    and time frame of the PHTR data capture remains a limita-
                                                             tion. Additional findings among Servicemembers with severe
                                                                                                    2
          Our data suggest that accurate detection of TBI is difficult   TBI suggest that only 6% return to active service.  Therefore,
          during early levels of care. TBI is challenging to classify with-  improvement in the quality of care has been a major focus of
          out imaging, especially hemorrhagic injuries. However, neu-  large military studies regarding casualties in recent conflicts,
          roimaging is not available in the Role 1 setting. A 2009 study   particularly early in the clinical course with limited diagnostic
          (n=3,973) reported that 21% of soldiers who returned home   facilities. Measurement of intracranial pressures, vasospasm,
                                                         15
          had an undiagnosed TBI, mostly minor concussive symptoms.    and cerebral autoregulation have been proposed recently for
          Another contrasting finding is the mechanism of injury in such   TBI detection in resource-limited settings. 4
          populations.  The most common causes underlying civilian
          TBI include falls (28%), followed by MVCs (20%), while ex-  Our study demonstrates comparable findings and new data in
          plosives are the predominant factor contributing to military   the prehospital setting; however, it is not without limitations.
          TBI. 9,10  However, this may be the result of biased reporting and   Linkage between the PHTR and the DoDTR is often difficult.
          inclusion procedures as minor TBIs from MVCs or falls may   Thus, few cases were available for inclusion in this analysis. The
          not even seek formal care beyond the unit medic or be man-  DoDTR requires that a casualty arrives at a facility with surgical
          aged without transfer to a higher level of care. The DoDTR   capabilities with signs of life or ongoing interventions, which
          has specific inclusion criteria that require transportation to a   thus excludes those that died in a lower level of care. 7,16  Data col-
          surgical facility, which may have led to missed cases within our   lection has also changed through these conflicts. The PHTR has
          data set.  Previously reported data found a higher percentage   limited periods of data capture for entry, so we cannot assess for
                 16
          of overall TBI during OIF and OEF due to explosions (78%),   changes that may have occurred during the conflicts. The data
          although the percentage related to explosions in our  TBI   captured has also changed frequently throughout the conflicts.
          cohort was lower (63%), and the differences were not sub-  Therefore, as the registry grew, the number of datapoints gen-
          stantial. 17,18  Our data highlight the need for appropriate tech-  erally increased. It is likely that many of the variables available
          nology to accurately aid in the diagnosis of TBI in the Role 1   for capture changed throughout the study period. Further, the
          setting.  This gap could be filled with technologies that are   study team did not have access to the raw data in the form of
          currently in development such as pupillometry, advanced   the TCCC cards or other written records and only had access

          26  |  JSOM   Volume 24, Edition 2 / Summer 2024