
Page 47 - JSOM Winter 2023
P. 47
signed-ranks nonparametric tests to compare the pre- and Time in Seconds
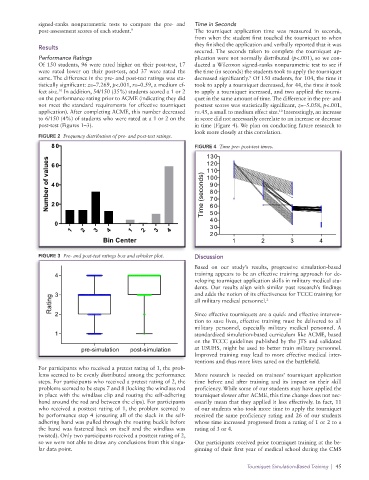
post- assessment scores of each student. 9 The tourniquet application time was measured in seconds,
from when the student first touched the tourniquet to when
they finished the application and verbally reported that it was
Results
secured. The seconds taken to complete the tourniquet ap-
Performance Ratings plication were not normally distributed (p<.001), so we con-
Of 150 students, 96 were rated higher on their post-test, 17 ducted a Wilcoxon signed-ranks nonparametric test to see if
were rated lower on their post-test, and 37 were rated the the time (in seconds) the students took to apply the tourniquet
same. The difference in the pre- and post-test ratings was sta- decreased significantly. Of 150 students, for 104, the time it
9
tistically significant: z=–7.269, p<.001, r=–0.59, a medium ef- took to apply a tourniquet decreased, for 44, the time it took
10
fect size. In addition, 54/150 (35%) students scored a 1 or 2 to apply a tourniquet increased, and two applied the tourni-
on the performance rating prior to ACME (indicating they did quet in the same amount of time. The difference in the pre- and
not meet the standard requirements for effective tourniquet posttest scores was statistically significant, z=–5.058, p<.001,
application). After completing ACME, this number decreased r=.45, a small to medium effect size. Interestingly, an increase
10
to 6/150 (4%) of students who were rated at a 1 or 2 on the in score did not necessarily correlate to an increase or decrease
post-test (Figures 1–3). in time (Figure 4). We plan on conducting future research to
Frequency distribution look more closely at this correlation.
FIGURE 2 Frequency distribution of pre- and post-test ratings.
time by rating pre and post
80 FIGURE 4 Time pre- post-test times.
pre-simulation
130
Number of values 40 Time (seconds) 110
post-simulation
120
60
100
90
80
70
20
50
40
0 60
30
1 2 3 4 1 2 3 4 20
Bin Center 1 2 3 4
ratings pre post box and whisker with scatter Rating
FIGURE 3 Pre- and post-test ratings box and whisker plot. Discussion
Based on our study’s results, progressive simulation-based
4 training appears to be an effective training approach for de-
veloping tourniquet application skills in military medical stu-
dents. Our results align with similar past research’s findings
3 and adds the notion of its effectiveness for TCCC training for
Rating all military medical personnel. 2
2
Since effective tourniquets are a quick and effective interven-
tion to save lives, effective training must be delivered to all
military personnel, especially military medical personnel. A
1 standardized simulation-based curriculum like ACME, based
on the TCCC guidelines published by the JTS and validated
pre-simulation post-simulation at USUHS, might be used to better train military personnel.
Improved training may lead to more effective medical inter-
ventions and thus more lives saved on the battlefield.
For participants who received a pretest rating of 1, the prob-
lems seemed to be evenly distributed among the performance More research is needed on trainees’ tourniquet application
steps. For participants who received a pretest rating of 2, the time before and after training and its impact on their skill
problems seemed to be steps 7 and 8 (locking the windlass rod proficiency. While some of our students may have applied the
in place with the windlass clip and routing the self-adhering tourniquet slower after ACME, this time change does not nec-
band around the rod and between the clips). For participants essarily mean that they applied it less effectively. In fact, 11
who received a posttest rating of 1, the problem seemed to of our students who took more time to apply the tourniquet
be performance step 4 (ensuring all of the slack in the self- received the same proficiency rating and 26 of our students
adhering band was pulled through the routing buckle before whose time increased progressed from a rating of 1 or 2 to a
the band was fastened back on itself and the windlass was rating of 3 or 4.
twisted). Only two participants received a posttest rating of 2,
so we were not able to draw any conclusions from this singu- Our participants received prior tourniquet training at the be-
lar data point. ginning of their first year of medical school during the CMS
Tourniquet Simulation-Based Training | 45