
Page 38 - JSOM Winter 2023
P. 38
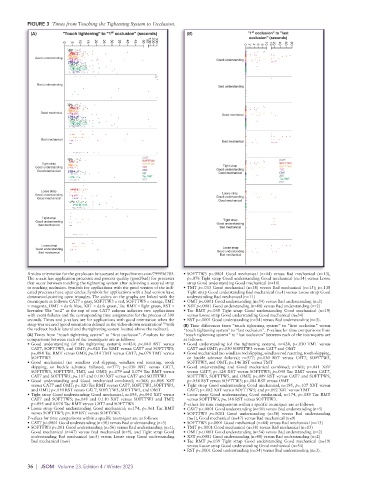
FIGURE 3  Times from Touching the Tightening System to Occlusion.
                                     st
                                                                                   st
           (A)       "Touch tightening" to "1 occlusion" (seconds)  (B)           "1 occlusion" to "last
                                                                                  occlusion" (seconds) 60  80
                                                 50
                                                   200
                                                    300
                           10
                                                  100
                                                50
                                   25
                                20
                             15
                                     30
                                             45
                                          40
                                        35
                      0
                        5
                                                                                    4
                                                                                            40
                                                                                     6
                                                                                         10
                                                                                          20
                                                                                      8
                                                                                        10
                                                                                  2
                                                                                 0
            Good understanding
                                                                        Good understanding
             Bad understanding                      n=2
                                                                        Bad understanding
              Good mechnical
                                                                         Good mechnical
              Bad mechanical
                                                                          Bad mechanical
                                               CAT7
                                               SOFTTW3                                      CAT7
               Tight strap                     SOFTTW5                                      SOFTTW3
            Good understanding                 TMT                        Tight strap       SOFTTW5
             Good mechanical                   OMT                      Good understanding  TMT
                                               X8T                      Good mechanical     OMT
                                               Tac RMT                                      X8T
                                               RST                                          Tac RMT
                                                                                            RST
              Loose strap
            Good understanding                                            Loose strap
             Good mechanical                                            Good understanding
                                                                        Good mechanical
               Tight strap
                                                                          Tight strap
             Good understanding                                         Good understanding
              Bad mechanical
                                                                         Bad mechanical
               Loose strap
                                                                          Loose strap
             Good understanding                                         Good understanding
              Bad mechanical
                                                                         Bad mechanical
          A video orientation for the graphs can be accessed at https://vimeo.com/799936785.   • SOFTTW5 p=.0001 Good mechanical (n=44) versus Bad mechanical (n=13),
          The x-axis has application processes and process quality (good/bad) for processes   p=.076 Tight strap Good understanding Good mechanical (n=34) versus Loose
          that occur between touching the tightening system after achieving a secured strap   strap Good understanding Good mechanical (n=10)
          to reaching occlusion. Symbols for applications with the good version of the indi-  • TMT p=.033 Good mechanical (n=38) versus Bad mechanical (n=15); p=.138
          cated processes have open circles. Symbols for applications with a bad version have   Tight strap Good understanding Bad mechanical (n=4) versus Loose strap Good
          downward-pointing open triangles. The colors on the graphs are linked with the   understanding Bad mechanical (n=11)
          tourniquets as follows: CAT7 = gray, SOFTTW3 = red, SOFTTW5 = orange, TMT   • OMT p<.0001 Good understanding (n=54) versus Bad understanding (n=2)
          = magenta, OMT = dark blue, X8T = dark green, Tac RMT = light green, RST =   • X8T p<.0001 Good understanding (n=48) versus Bad understanding (n=2)
          lavender. The “n=2” at the top of one CAT7 column indicates two applications   • Tac RMT p=.039  Tight strap Good understanding Good mechanical (n=19)
          with event failures and the corresponding time assignments for the process of 300   versus Loose strap Good understanding Good mechanical (n=34)
          seconds. Times and p-values are for applications with good orientation when the   • RST p<.0001 Good understanding (n=54) versus Bad understanding (n=3).
          strap was secured (good orientation defined as the video-shown orientation 2-10  with   (B) Time differences from “touch tightening system” to “first occlusion” versus
          the redirect buckle lateral and the tightening system located above the redirect).  “touch tightening system” to “last occlusion”. P-values for time comparisons from
          (A) Times from “touch tightening system” to “first occlusion”. P-values for time   “touch tightening system” to “last occlusion” between each of the tourniquets are
          comparisons between each of the tourniquets are as follows:  as follows:
          • Good understanding (of the tightening system); n=424; p<.040 RST versus   • Good understanding (of the tightening system), n=424, p<.030 TMT  versus
           CAT7, SOFTTW5, and OMT; p<.020 Tac RMT versus CAT7 and SOFTTW5;   CAT7 and OMT; p<.050 SOFTTW3 versus CAT7 and OMT
           p=.084 Tac RMT versus OMT; p=.014 TMT versus CAT7; p=.078 TMT versus   • Good mechanical (no windlass rod slipping, windlass rod resetting, tooth skipping,
           SOFTTW5                                            or buckle advance failures); n=377; p<.030 RST versus CAT7, SOFTTW3,
          • Good  mechanical  (no windlass rod  slipping,  windlass rod resetting, tooth   SOFTTW5, and OMT; p=.146 RST versus TMT
           skipping, or buckle advance failures); n=377; p<.030 RST versus CAT7,   • Good understanding and Good mechanical combined; n=368; p=.041 X8T
           SOFTTW3, SOFTTW5, TMT, and OMT; p=.079 and 0.074 Tac RMT versus   versus CAT7; p=.124 X8T versus SOFTTW5; p<.040 Tac RMT versus CAT7,
           CAT7 and SOFTTW5; p=.107 and 0.100 X8T versus CAT7 and SOFTTW5  SOFTTW3, SOFTTW5, and OMT; p<.009 RST versus CAT7 and SOFTTW5;
          • Good understanding and Good mechanical combined; n=368; p<.008 X8T   p=.054 RST versus SOFTTW3; p=.084 RST versus OMT
           versus CAT7 and OMT; p<.020 Tac RMT versus CAT7, SOFTTW3, SOFTTW5,   • Tight strap Good understanding Good mechanical, n=195, p=.107 X8T versus
           and OMT; p<.050 RST versus CAT7, SOFTTW3, SOFTTW5, and OMT  CAT7; p=.082 X8T versus SOFTTW5; and p=.092 X8T versus TMT
          • Tight strap Good understanding Good mechanical, n=195, p<.040 X8T versus   • Loose strap Good understanding Good mechanical, n=174, p=.089 Tac RMT
           CAT7 and SOFTTW5; p=.148 and 0.110 X8T versus SOFTTW3 and  TMT;   versus SOFTTW3; p=.148 RST versus SOFTTW3.
           p=.095 and 0.078 Tac RMT versus CAT7 and SOFTTW5  P-values for time comparisons within a specific tourniquet are as follows:
          • Loose strap Good understanding Good mechanical; n=174, p=.061 Tac RMT   • CAT7 p<.0001 Good understanding (n=50) versus Bad understanding (n=5)
           versus SOFTTW3; p=.109 RST versus SOFTTW3.        • SOFTTW3 p<.0001  Good understanding  (n=56)  versus Bad understanding
          P-values for time comparisons within a specific tourniquet are as follows:  (n=1), Good mechanical (n=47) versus Bad mechanical (n=9)
          • CAT7 p<.0001 Good understanding (n=50) versus Bad understanding (n=5)  • SOFTTW5 p<.0001 Good mechanical (n=44) versus Bad mechanical (n=13)
          • SOFTTW3 p<.001 Good understanding (n=56) versus Bad understanding (n=1),   • TMT p<.0001 Good mechanical (n=38) versus Bad mechanical (n=15)
           Good mechanical (n=47) versus Bad mechanical (n=9), and Tight strap Good   • OMT p<.0001 Good understanding (n=54) versus Bad understanding (n=2)
           understanding Bad  mechanical  (n=3)  versus  Loose  strap  Good  understanding   • X8T p<.0001 Good understanding (n=48) versus Bad understanding (n=2)
           Bad mechanical (n=6)                              • Tac RMT p=.039  Tight strap Good understanding Good mechanical (n=19)
                                                              versus Loose strap Good understanding Good mechanical (n=34)
                                                             • RST p<.0001 Good understanding (n=54) versus Bad understanding (n=3).
          36  |  JSOM   Volume 23, Edition 4 / Winter 2023