
Page 78 - JSOM Fall 2023
P. 78
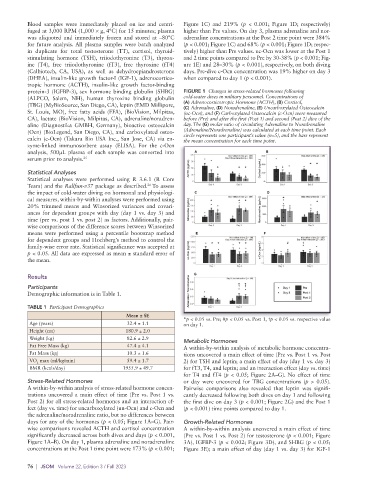
Blood samples were immediately placed on ice and centri-  Figure 1C) and 219% (p < 0.001; Figure 1D; respectively)
          fuged at 3,000 RPM (1,000 × g, 4°C) for 15 minutes; plasma   higher than Pre values. On day 3, plasma adrenaline and nor-
          was aliquoted and immediately frozen and stored at –80°C   adrenaline concentrations at the Post 2 time point were 384%
          for future analysis. All plasma samples were batch analyzed   (p < 0.001; Figure 1C) and 68% (p < 0.001; Figure 1D; respec-
          in duplicate for total testosterone (TT), cortisol, thyroid-   tively) higher than Pre values. uc-Ocn was lower at the Post 1
          stimulating hormone (TSH), triiodothyronine (T3), thyrox-  and 2 time points compared to Pre by 30-38% (p < 0.001; Fig-
          ine (T4), free triiodothyronine (fT3), free thyroxine (fT4)   ure 1E) and 28–30% (p < 0.001), respectively, on both diving
          (Calbiotech, CA, USA), as well as dehydroepiandrosterone   days. Pre-dive c-Ocn concentration was 19% higher on day 3
          (DHEA), insulin-like growth factor-I (IGF-1), adrenocortico-  when compared to day 1 (p < 0.001).
          tropic hormone (ACTH), insulin-like growth factor-binding
          protein-3 ( IGFBP-3), sex hormone binding globulin (SHBG)   FIGURE 1  Changes in stress-related hormones following
          (ALPCO,  Salem,  NH),  human  thyroxine  binding  globulin   cold-water dives in military personnel. Concentrations of
          (TBG) ( MyBioSource, San Diego, CA), leptin (EMD Millipore,   (A) Adrenocorticotropic Hormone (ACTH), (B) Cortisol,
                                                             (C) Adrenaline, (D) Noradrenaline, (E) Uncarboxylated Osteocalcin
          St. Louis, MO), free fatty  acids (FFA), (BioVision, Milpitas,   (uc-Ocn), and (F) Carboxylated Osteocalcin (c-Ocn) were measured
          CA), lactate  (BioVision,  Milpitas, CA),  adrenaline/noradren-  before (Pre) and after the first (Post 1) and second (Post 2) dive of the
          aline (Diagnostika GMBH, Germany), bioactive osteocalcin   day. The (G) molar ratio of circulating Adrenaline to Noradrenaline
          (Ocn) (BioLegend, San Diego, CA), and carboxylated osteo-  (Adrenaline/Noradrenaline) was calculated at each time point. Each
          calcin (c-Ocn) (Takara Bio USA Inc., San Jose, CA) via en-  circle represents one participant’s value (n=5), and the bars represent
                                                             the mean concentration for each time point.
          zyme-linked immunosorbent assay (ELISA). For the c-Ocn
          analysis, 500µL plasma of each sample was converted into
          serum prior to analysis. 25
          Statistical Analyses
          Statistical analyses were performed using R 3.6.1 (R Core
                                                 26
          Team) and the Rallfun-v37 package as described. To assess
          the impact of cold-water diving on hormonal and physiologi-
          cal measures, within-by-within analyses were performed using
          20% trimmed means and Winsorized variances and covari-
          ances for dependent groups with day (day 1 vs. day 3) and
          time (pre vs. post 1 vs. post 2) as factors. Additionally, pair-
          wise comparisons of the difference scores between Winsorized
          means were performed using a percentile bootstrap method
          for dependent groups and Hochberg’s method to control the
          family-wise error rate. Statistical significance was accepted at
          p < 0.05. All data are expressed as mean ± standard error of
          the mean.


          Results
          Participants
          Demographic information is in Table 1.

          TABLE 1  Participant Demographics
                                          Mean ± SE
                                                             *p < 0.05 vs. Pre; #p < 0.05 vs. Post 1,  †p < 0.05 vs. respective value
           Age (years)                    32.4 ± 1.1         on day 1.
           Height (cm)                    180.9 ± 2.0
           Weight (kg)                    82.6 ± 2.9         Metabolic Hormones
           Fat Free Mass (kg)             47.4 ± 4.1         A within-by-within analysis of metabolic hormone concentra-
           Fat Mass (kg)                  10.3 ± 1.6         tions uncovered a main effect of time (Pre vs. Post 1 vs. Post
           VO  max (ml/kg/min)            59.4 ± 1.7         2) for TSH and leptin; a main effect of day (day 1 vs. day 3)
             2
           BMR (kcals/day)               1955.9 ± 49.7       for fT3, T4, and leptin; and an interaction effect (day vs. time)
                                                             for T4 and fT4 (p < 0.05; Figure 2A–G). No effect of time
          Stress-Related Hormones                            or day were uncovered for TBG concentrations (p > 0.05).
          A within-by-within analysis of stress-related hormone concen-  Pairwise  comparisons  also revealed  that  leptin was  signifi-
          trations uncovered a main effect of time (Pre vs. Post 1 vs.   cantly decreased following both dives on day 1 and following
          Post 2) for all stress-related hormones and an interaction ef-  the first dive on day 3 (p < 0.001; Figure 2G) and the Post 1
          fect (day vs. time) for uncarboxylated (un-Ocn) and c-Ocn and   (p < 0.001) time points compared to day 1.
          the adrenaline/noradrenaline ratio, but no differences between
          days for any of the hormones (p < 0.05; Figure 1A–G). Pair-  Growth-Related Hormones
          wise comparisons revealed ACTH and cortisol concentration   A within-by-within analysis uncovered a main effect of time
          significantly decreased across both dives and days (p < 0.001,   (Pre vs. Post 1 vs. Post 2) for testosterone (p < 0.001; Figure
          Figure 1A–B). On day 1, plasma adrenaline and noradrenaline   3A), IGFBP-3 (p < 0.002; Figure 3D), and SHBG (p < 0.05;
          concentrations at the Post 1 time point were 173% (p < 0.001;   Figure 3E); a main effect of day (day 1 vs. day 3) for IGF-1

          76  |  JSOM   Volume 22, Edition 3 / Fall 2023