
Page 77 - JSOM Summer 2023
P. 77
in seconds for 280 localization attempts. Correct and incorrect In the longitudinal view, the catheter frequently caused a shad-
answers were compared. Data were determined to be lognor- owing artifact, similar to comet tails described in pulmonary
mal using the normality and lognormality tests in GraphPad edema (Figure 3, A). In the transverse views, the REBOA cath-
Prism version 9.3.1 for Windows (GraphPad Software; www. eter looked similar to a “bullseye” within the lumen of the
graphpad.com). Data were log transformed and compared aorta (Figure 3, B). For placement in Zone 1, the anatomy
using an unpaired t-test and were considered significant at within the thoracic cavity made transverse views difficult to
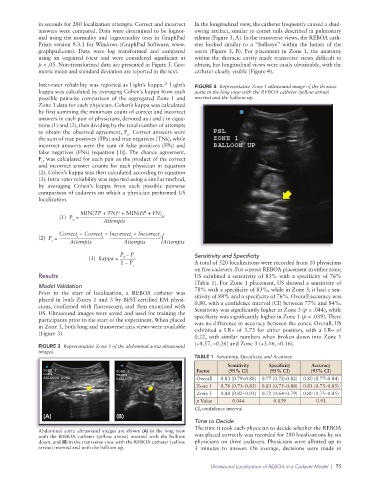
p < .05. Non-transformed data are presented in Figure 5. Geo- obtain, but longitudinal views were easily obtainable, with the
metric mean and standard deviation are reported in the text. catheter clearly visible (Figure 4).
23
Inter-rater reliability was reported as Light’s kappa. Light’s FIGURE 4 Representative Zone 1 ultrasound image of the thoracic
kappa was calculated by averaging Cohen’s kappa from each aorta in the long view with the REBOA catheter (yellow arrow)
possible pairwise comparison of the aggregated Zone 1 and inserted and the balloon up.
Zone 3 data for each physician. Cohen’s kappa was calculated
by first summing the minimum count of correct and incorrect
answers in each pair of physicians, denoted as i and j in equa-
tions (1) and (2), then dividing by the total number of attempts
to obtain the observed agreement, P . Correct answers were
o
the sum of true positives (TPs) and true negatives (TNs), while
incorrect answers were the sum of false positives (FPs) and
false negatives (FNs) (equation [1]). The chance agreement,
P , was calculated for each pair as the product of the correct
c
and incorrect answer counts for each physician in equation
(2). Cohen’s kappa was then calculated according to equation
(3). Intra-rater reliability was reported using a similar method,
by averaging Cohen’s kappa from each possible pairwise
comparison of cadavers on which a physician performed US
localization.
i,j
MIN(TP + TN) + MIN(FP + FN)
(1) P = i,j
0 Attempts
Correct × Correct = Incorrect × Incorrect
(2) P = i j i j /
c Attempts Attempts Attempts
P – P Sensitivity and Specificity
(3) kappa = 0 c
1 – P A total of 520 localizations were recorded from 10 physicians
c
on five cadavers. For correct REBOA placement in either zone,
Results US exhibited a sensitivity of 83% with a specificity of 76%
(Table 1). For Zone 1 placement, US showed a sensitivity of
Model Validation
Prior to the start of localization, a REBOA catheter was 78% with a specificity of 83%, while in Zone 3, it had a sen-
placed in both Zones 1 and 3 by BEST-certified EM physi- sitivity of 88% and a specificity of 76%. Overall accuracy was
cians, confirmed with fluoroscopy, and then examined with 0.80, with a confidence interval (CI) between 77% and 84%.
US. Ultrasound images were saved and used for training the Sensitivity was significantly higher in Zone 3 (p = .044), while
participants prior to the start of the experiment. When placed specificity was significantly higher in Zone 1 (p = .039). There
in Zone 3, both long and transverse axis views were available was no difference in accuracy between the zones. Overall, US
(Figure 3). exhibited a LR+ of 3.73 for either position, with a LR– of
0.22, with similar numbers when broken down into Zone 1
(+4.57, –0.26) and Zone 3 (+3.16, –0.16).
FIGURE 3 Representative Zone 3 of the abdominal aorta ultrasound
images.
TABLE 1 Sensitivity, Specificity, and Accuracy
Sensitivity Specificity Accuracy
Factor (95% CI) (95% CI) (95% CI)
Overall 0.83 (0.79–0.88) 0.77 (0.72–0.82) 0.80 (0.77–0.84)
Zone 1 0.78 (0.71–0.85) 0.83 (0.75–0.88) 0.81 (0.75–0.85)
Zone 3 0.88 (0.82–0.93) 0.72 (0.64–0.79) 0.80 (0.75–0.85)
p Value 0.044 0.039 0.91
CI, confidence interval
(A) (B)
Time to Decide
The time it took each physician to decide whether the REBOA
Abdominal aorta ultrasound images are shown (A) in the long view
with the REBOA catheter (yellow arrow) inserted with the balloon was placed correctly was recorded for 280 localizations by six
down, and (B) in the transverse view with the REBOA catheter (yellow physicians on three cadavers. Physicians were allotted up to
arrow) inserted and with the balloon up. 3 minutes to answer. On average, decisions were made in
Ultrasound Localization of REBOA in a Cadaver Model | 75