
Page 51 - JSOM Spring 2023
P. 51
were documented in the EHR by nursing staff, and served as hospital chart. Table 2 describes causes of blood loss, and
the “post-transfusion temperature.” If patients were taken di- Table 3 describes the blood products received by type.
rectly to the OR upon arrival, the first documented OR tem-
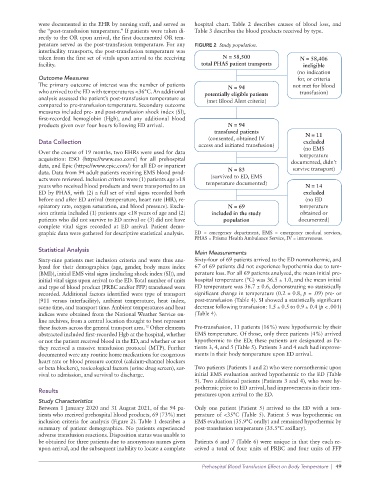
perature served as the post-transfusion temperature. For any FIGURE 2 Study population.
interfacility transports, the post-transfusion temperature was
taken from the first set of vitals upon arrival to the receiving N = 58,500 N = 58,406
facility. total PHAS patient transports ineligible
(no indication
Outcome Measures for, or criteria
The primary outcome of interest was the number of patients N = 94 not met for blood
who arrived to the ED with temperatures <36°C. An additional potentially eligible patients transfusion)
analysis assessed the patient’s post-transfusion temperature as (met Blood Alert criteria)
compared to pre-transfusion temperature. Secondary outcome
measures included pre- and post-transfusion shock index (SI),
first-recorded hemoglobin (Hgb), and any additional blood
products given over four hours following ED arrival. N = 94
transfused patients
(consented, obtained IV N = 11
Data Collection excluded
access and initiated transfusion)
(no EMS
Over the course of 19 months, two EHRs were used for data temperature
acquisition: ESO (https://www.eso.com/) for all prehospital documented, didn’t
data, and Epic (https://www.epic.com/) for all ED or inpatient survive transport)
data. Data from 94 adult patients receiving EMS blood prod- N = 83
ucts were reviewed. Inclusion criteria were (1) patients age >18 (survived to ED, EMS
years who received blood products and were transported to an temperature documented) N = 14
ED by PHAS, with (2) a full set of vital signs recorded both excluded
before and after ED arrival (temperature, heart rate (HR), re- (no ED
spiratory rate, oxygen saturation, and blood pressure). Exclu- N = 69 temperature
sion criteria included (1) patients age <18 years of age and (2) included in the study obtained or
patients who did not survive to ED arrival or (3) did not have population documented)
complete vital signs recorded at ED arrival. Patient demo-
graphic data were gathered for descriptive statistical analysis. ED = emergency department, EMS = emergency medical services,
PHAS = Prisma Health Ambulance Service, IV = intravenous.
Statistical Analysis Main Measurements
Sixty-nine patients met inclusion criteria and were thus ana- Sixty-four of 69 patients arrived to the ED normothermic, and
lyzed for their demographics (age, gender, body mass index 67 of 69 patients did not experience hypothermia due to tem-
(BMI)), initial EMS vital signs (including shock index (SI)), and perature loss. For all 69 patients analyzed, the mean initial pre-
initial vital signs upon arrival to the ED. Total number of units hospital temperature (°C) was 36.5 ± 1.0, and the mean initial
and type of blood product (PRBC and/or FFP) transfused were ED temperature was 36.7 ± 0.6, demonstrating no statistically
recorded. Additional factors identified were type of transport significant change in temperature (0.2 ± 0.8, p = .09) pre- or
(911 versus interfacility), ambient temperature, heat index, post-transfusion (Table 4). SI showed a statistically significant
scene time, and transport time. Ambient temperatures and heat decrease following transfusion: 1.5 ± 0.5 to 0.9 ± 0.4 (p < .001)
indices were obtained from the National Weather Service on- (Table 4).
line archives, from a central location thought to best represent
12
these factors across the general transport area. Other elements Pre-transfusion, 11 patients (16%) were hypothermic by their
abstracted included first-recorded Hgb at the hospital, whether EMS temperature. Of those, only three patients (4%) arrived
or not the patient received blood in the ED, and whether or not hypothermic to the ED; these patients are designated as Pa-
they received a massive transfusion protocol (MTP). Further tients 3, 4, and 5 (Table 5). Patients 3 and 4 each had improve-
documented were any routine home medications for exogenous ments in their body temperature upon ED arrival.
heart rate or blood pressure control (calcium-channel blockers
or beta blockers), toxicological factors (urine drug screen), sur- Two patients (Patients 1 and 2) who were normothermic upon
vival to admission, and survival to discharge. initial EMS evaluation arrived hypothermic to the ED (Table
5). Two additional patients (Patients 3 and 4), who were hy-
pothermic prior to ED arrival, had improvements in their tem-
Results
peratures upon arrival to the ED.
Study Characteristics
Between 1 January 2020 and 31 August 2021, of the 94 pa- Only one patient (Patient 5) arrived to the ED with a tem-
tients who received prehospital blood products, 69 (73%) met perature of <35°C (Table 5). Patient 5 was hypothermic on
inclusion criteria for analysis (Figure 2). Table 1 describes a EMS evaluation (35.9°C orally) and remained hypothermic by
summary of patient demographics. No patients experienced post-transfusion temperature (35.5°C axillary).
adverse transfusion reactions. Disposition status was unable to
be obtained for three patients due to anonymous names given Patients 6 and 7 (Table 6) were unique in that they each re-
upon arrival, and the subsequent inability to locate a complete ceived a total of four units of PRBC and four units of FFP
Prehospital Blood Transfusion Effect on Body Temperature | 49