
Page 112 - JSOM Spring 2023
P. 112
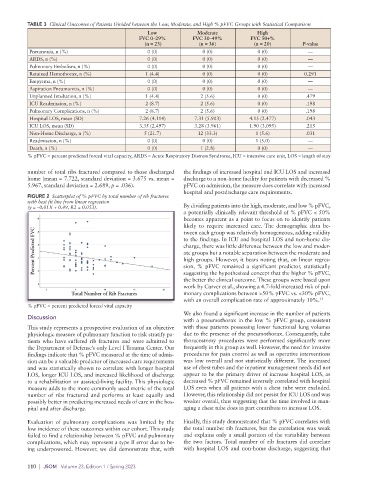
TABLE 3  Clinical Outcomes of Patients Divided between the Low, Moderate, and High % pFVC Groups with Statistical Comparison
                                                 Low             Moderate            High
                                              FVC 0–29%         FVC 30–49%         FVC 50+%
                                                 (n = 23)         (n = 36)          (n = 20)        P-value
           Pneumonia, n (%)                      0 (0)             0 (0)             0 (0)            —
           ARDS, n (%)                           0 (0)             0 (0)             0 (0)            —
           Pulmonary Embolism, n (%)             0 (0)             0 (0)             0 (0)            —
           Retained Hemothorax, n (%)            1 (4.4)           0 (0)             0 (0)          0.291
           Empyema, n (%)                        0 (0)             0 (0)             0 (0)            —
           Aspiration Pneumonitis, n (%)         0 (0)             0 (0)             0 (0)            —
           Unplanned Intubation, n (%)           1 (4.4)           2 (5.6)           0 (0)           .479
           ICU Readmission, n (%)                2 (8.7)           2 (5.6)           0 (0)           .198
           Pulmonary Complications, n (%)        2 (8.7)           2 (5.6)           0 (0)           .198
           Hospital LOS, mean (SD)             7.26 (4.114)      7.31 (5.903)      4.15 (2.477)      .043
           ICU LOS, mean (SD)                  3.35 (2.497)      3.28 (3.961)      1.90 (3.095)      .215
           Non-Home Discharge, n (%)            5 (21.7)          12 (33.3)          1 (5.6)         .031
           Readmission, n (%)                    0 (0)             0 (0)             1 (5.0)          —
           Death, n (%)                          0 (0)             1 (2.8)           0 (0)            —
          % pFVC = percent predicted forced vital capacity, ARDS = Acute Respiratory Distress Syndrome, ICU = intensive care unit, LOS = length of stay

          number of total ribs fractured compared to those discharged   the findings of increased hospital and ICU LOS and increased
          home (mean = 7.722, standard deviation = 3.675 vs. mean =   discharge to a non-home facility for patients with decreased %
          5.967, standard deviation = 2.689, p = .036).      pFVC on admission, the measure does correlate with increased
                                                             hospital and postdischarge care requirements.
          FIGURE 2  Scatterplot of % pFVC by total number of rib fractures
          with best fit line from linear regression
          (y = –0.01X + 0.49, R2 = 0.053).                   By dividing patients into the high, moderate, and low % pFVC,
                                                             a potentially clinically relevant threshold of % pFVC < 50%
                                                             becomes apparent as a point to focus on to identify patients
                                                             likely  to  require  increased  care.  The  demographic  data  be-
            Percent Predicted FVC                            to the findings. In ICU and hospital LOS and non-home dis-
                                                             tween each group was relatively homogeneous, adding validity

                                                             charge, there was little difference between the low and moder-
                                                             ate groups but a notable separation between the moderate and
                                                             high groups. However, it bears noting that, on linear regres-
                                                             sion, % pFVC remained a significant predictor, statistically
                                                             suggesting the hypothesized concept that the higher % pFVC,
                                                             the better the clinical outcome. These groups were based upon
                                                             work by Carver et al., showing a 4.7-fold increased risk of pul-
                        Total Number of Rib Fractures        monary complications between >50% pFVC vs. <30% pFVC,
                                                             with an overall complication rate of approximately 10%. 13
          % pFVC = percent predicted forced vital capacity
                                                             We also found a significant increase in the number of patients
          Discussion                                         with a pneumothorax in the low % pFVC group, consistent
          This study represents a prospective evaluation of an objective   with these patients possessing lower functional lung volumes
          physiologic measure of pulmonary function to risk stratify pa-  due to the presence of the pneumothorax. Consequently, tube
          tients who have suffered rib fractures and were admitted to   thoracostomy procedures were performed significantly more
          the Department of Defense’s only Level I Trauma Center. Our   frequently in this group as well. However, the need for invasive
          findings indicate that % pFVC measured at the time of admis-  procedures for pain control as well as operative interventions
          sion can be a valuable predictor of increased care requirements   was low overall and not statistically different. The increased
          and was statistically shown to correlate with longer hospital   use of chest tubes and the inpatient management needs did not
          LOS, longer ICU LOS, and increased likelihood of discharge   appear to be the primary driver of increase hospital LOS, as
          to a rehabilitation or assisted-living facility. This physiologic   decreased % pFVC remained inversely correlated with hospital
          measure adds to the more commonly used metric of the total   LOS even when all patients with a chest tube were excluded.
          number of ribs fractured and performs at least equally and   However, this relationship did not persist for ICU LOS and was
          possibly better in predicting increased needs of care in the hos-  weaker overall, thus suggesting that the time involved in man-
          pital and after discharge.                         aging a chest tube does in part contribute to increase LOS.
          Evaluation of pulmonary complications was limited by the   Finally, this study demonstrated that % pFVC correlates with
          low incidence of these outcomes within our cohort. This study   the total number rib fractures, but the correlation was weak
          failed to find a relationship between % pFVC and pulmonary   and explains only a small portion of the variability between
          complications, which may represent a type II error due to be-  the two factors. Total number of rib fractures did correlate
          ing underpowered. However, we did demonstrate that, with   with hospital LOS and non-home discharge, suggesting that

          110  |  JSOM   Volume 23, Edition 1 / Spring 2023