
Page 111 - JSOM Spring 2023
P. 111
which 47.8% (n = 11) of patients in the low group, 13.9% (n = 5) respectively, p = .215). However, on linear regression decreased
of patients in the moderate group, and 20.0% (n = 4) of patients % FVC was inversely very weakly correlated with both longer
in the high group had a pneumothorax (P = .028). Additionally, hospital LOS (r = –0.282, p = .006) and longer ICU LOS (r =
an increased number of rib fractures was very weakly correlated –0.197, p = .041). Overall, patients discharged to a non-home
(r 0.30) with a reduced % pFVC (r = –0.235, p = .037). location had a lower average % pFVC than those discharged
to home (mean = 34.24%, standard deviation = 8.03%, vs.
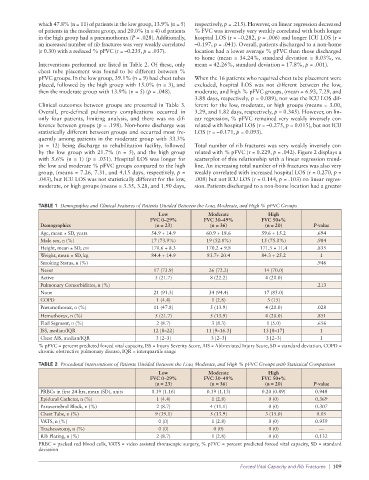
Interventions performed are listed in Table 2. Of these, only mean = 42.26%, standard deviation = 17.8%, p = .001).
chest tube placement was found to be different between %
pFVC groups. In the low group, 39.1% (n = 9) had chest tubes When the 16 patients who required chest tube placement were
placed, followed by the high group with 15.0% (n = 3), and excluded, hospital LOS was not different between the low,
then the moderate group with 13.9% (n = 5) (p = .048). moderate, and high % pFVC groups, (mean = 6.93, 7.29, and
3.88 days, respectively, p = 0.089), nor was the ICU LOS dif-
Clinical outcomes between groups are presented in Table 3. ferent for the low, moderate, or high groups (means = 3.00,
Overall, pre-defined pulmonary complications occurred in 3.29, and 1.82 days, respectively, p = 0.345). However, on lin-
only four patients, limiting analysis, and there was no dif- ear regression, % pFVC remained very weakly inversely cor-
ference between groups (p = .198). Non-home discharge was related with hospital LOS (r = –0.275, p = 0.015), but not ICU
statistically different between groups and occurred most fre- LOS (r = –0.171, p = 0.093).
quently among patients in the moderate group with 33.3%
(n = 12) being discharge to rehabilitation facility, followed Total number of rib fractures was very weakly inversely cor-
by the low group with 21.7% (n = 5), and the high group related with % pFVC (r = 0.229, p = .042). Figure 2 displays a
with 5.6% (n = 1) (p = .031). Hospital LOS was longer for scatterplot of this relationship with a linear regression trend-
the low and moderate % pFVC groups compared to the high line. An increasing total number of rib fractures was also very
group, (means = 7.26, 7.31, and 4.15 days, respectively, p = weakly correlated with increased hospital LOS (r = 0.270, p =
.043), but ICU LOS was not statistically different for the low, .008) but not ICU LOS (r = 0.144, p = .103) on linear regres-
moderate, or high groups (means = 3.35, 3.28, and 1.90 days, sion. Patients discharged to a non-home location had a greater
TABLE 1 Demographic and Clinical Features of Patients Divided Between the Low, Moderate, and High % pFVC Groups
Low Moderate High
FVC 0–29% FVC 30–49% FVC 50+%
Demographics (n = 23) (n = 36) (n = 20) P-value
Age, mean ± SD, years 54.9 + 14.9 60.9 + 18.6 59.6 + 15.2 .694
Male sex, n (%) 17 (73.9%) 19 (52.8%) 15 (75.0%) .984
Height, mean ± SD, cm 170.6 + 8.3 170.2 + 9.8 171.5 + 11.4 .835
Weight, mean ± SD, kg 84.4 + 14.9 83.7+ 20.4 84.3 + 25.2 1
Smoking Status, n (%) .946
Never 17 (73.9) 26 (72.2) 14 (70.0)
Active 5 (21.7) 8 (22.2) 4 (20.0)
Pulmonary Comorbidities, n (%) .213
None 21 (91.3) 34 (94.4) 17 (85.0)
COPD 1 (4.4) 1 (2.8) 3 (15)
Pneumothorax, n (%) 11 (47.8) 5 (13.9) 4 (20.0) .028
Hemothorax, n (%) 5 (21.7) 5 (13.9) 4 (20.0) .851
Flail Segment, n (%) 2 (8.7) 3 (8.3) 1 (5.0) .656
ISS, median/IQR 12 [8–22] 11 [9–16.3] 13 [8–17] 1
Chest AIS, median/IQR 3 [2–3] 3 [2–3] 3 [2–3] 1
% pFVC = percent predicted forced vital capacity, ISS = Injury Severity Score, AIS = Abbreviated Injury Score, SD = standard deviation, COPD =
chronic obstructive pulmonary disease, IQR = interquartile range
TABLE 2 Procedural Interventions of Patients Divided Between the Low, Moderate, and High % pFVC Groups with Statistical Comparison
Low Moderate High
FVC 0–29% FVC 30–49% FVC 50+%
(n = 23) (n = 36) (n = 20) P-value
PRBCs in first 24-hrs, mean (SD), units 0.39 (1.16) 0.39 (1.13) 0.20 (0.89) 0.948
Epidural Catheter, n (%) 1 (4.4) 1 (2.8) 0 (0) 0.369
Paravertebral Block, n (%) 2 (8.7) 4 (11.1) 0 (0) 0.307
Chest Tube, n (%) 9 (39.1) 5 (13.9) 3 (15.0) 0.05
VATS, n (%) 0 (0) 1 (2.8) 0 (0) 0.959
Tracheostomy, n (%) 0 (0) 0 (0) 0 (0) —
Rib Plating, n (%) 2 (8.7) 1 (2.8) 0 (0) 0.132
PRBC = packed red blood cells, VATS = video assisted thorascopic surgery, % pFVC = percent predicted forced vital capacity, SD = standard
deviation
Forced Vital Capacity and Rib Fractures | 109