
Page 115 - JSOM Winter 2022
P. 115
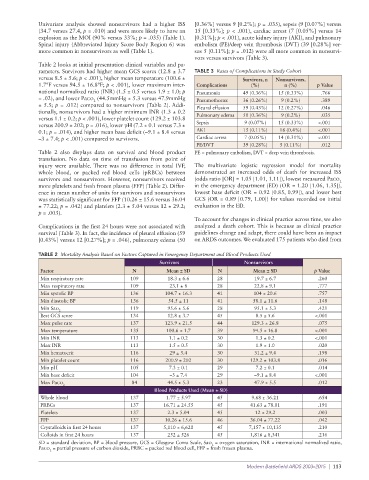
Univariate analysis showed nonsurvivors had a higher ISS   [0.36%] versus 9 [0.2%]; p = .035), sepsis (9 [0.07%] versus
              (34.7 versus 27.4, p = .010) and were more likely to have an   15 [0.33%]; p < .001), cardiac arrest (7 [0.05%] versus 14
              explosion as the MOI (90% versus 33%; p = .035) (Table 1).   [0.31%]; p < .001), acute kidney injury (AKI), and pulmonary
              Spinal injury (Abbreviated Injury Score Body Region 6) was   embolism (PE)/deep vein thrombosis (DVT) (39 [0.28%] ver-
              more common in nonsurvivors as well (Table 1).     sus 5 [0.11%]; p = .012) were all more common in nonsurvi-
                                                                 vors versus survivors (Table 3).
              Table 2 looks at initial presentation clinical variables and pa-
              rameters. Survivors had higher mean GCS scores (12.8 ± 3.7   TABLE 3  Rates of Complications in Study Cohort
              versus 8.5 ± 5.6; p < .001), higher mean temperature (100.6 ±     Survivors, n   Nonsurvivors,
              1.7°F versus 94.5 ± 16.8°F; p < .001), lower maximum inter-  Complications  (%)  n (%)     p Value
              national normalized ratio (INR) (1.5 ± 0.5 versus 1.9 ± 1.0; p   Pneumonia  49 (0.36%)  15 (0.33%)  .766
              = .02), and lower Paco  (44.5mmHg ± 5.3 versus 47.9mmHg   Pneumothorax  36 (0.26%)  9 (0.2%)  .389
                                2
              ± 5.5; p = .012) compared to nonsurvivors (Table 2). Addi-  Pleural effusion  59 (0.43%)  12 (0.27%)  .046
              tionally, nonsurvivors had a higher minimum INR (1.3 ± 0.2
              versus 1.1 ± 0.2; p < .001), lower platelet count (129.2 ± 103.8   Pulmonary edema  50 (0.36%)  9 (0.2%)  .035
              versus 200.9 ± 202; p = .016), lower pH (7.2 ± 0.1 versus 7.3 ±   Sepsis  9 (0.07%)  15 (0.33%)  <.001
              0.1; p = .014), and higher mean base deficit (–9.1 ± 8.4 versus   AKI  15 (0.11%)  18 (0.4%)  <.001
              –3 ± 7.4; p < .001) compared to survivors.         Cardiac arrest  7 (0.05%)  14 (0.31%)   <.001
                                                                 PE/DVT         39 (0.28%)  5 (0.11%)     .012
              Table 2 also displays data on survival and blood product   PE = pulmonary embolism, DVT = deep vein thrombosis.
              transfusion. No data on time of transfusion from point of
              injury were available. There was no difference in total IVF,   The multivariate logistic regression model for mortality
              whole blood, or packed red blood cells (pRBCs) between   demonstrated an increased odds of death for increased ISS
              survivors and nonsurvivors. However, nonsurvivors received   (odds ratio [OR] = 1.05 [1.01, 1.11]), lowest measured Paco 2
              more platelets and fresh frozen plasma (FFP) (Table 2). Differ-  in the emergency department (ED) (OR = 1.20 [1.06, 1.35]),
              ence in mean number of units for survivors and nonsurvivors   lowest base deficit (OR = 0.92 [0.85, 0.99]), and lower best
              was statistically significant for FFP (10.26 ± 15.6 versus 36.04   GCS (OR = 0.89 [0.79, 1.00]) for values recorded on initial
              ± 77.22; p = .042) and platelets (2.3 ± 5.04 versus 12 ± 29.2;   evaluation in the ED.
              p = .003).
                                                                 To account for changes in clinical practice across time, we also
              Complications in the first 24 hours were not associated with   analyzed a death cohort. This is because as clinical practice
              survival (Table 3). In fact, the incidence of pleural effusion (59   guidelines change and adapt, there could have been an impact
              [0.43%] versus 12 [0.27%]; p = .046), pulmonary edema (50   on ARDS outcomes. We evaluated 175 patients who died from

              TABLE 2  Mortality Analysis Based on Factors Captured in Emergency Department and Blood Products Used
                                                     Survivors                   Nonsurvivors
              Factor                        N          Mean ± SD        N           Mean ± SD           p Value
              Min respiratory rate          109         18.3 ± 6.6      28          19.7 ± 6.7           .260
              Max respiratory rate          109         23.1 ± 8        28          22.8 ± 9.1           .777
              Min systolic BP               136        104.7 ± 16.3     41          104 ± 20.6           .757
              Min diastolic BP              136         54.5 ± 11       41          58.1 ± 11.6          .148
              Min Sao                       119         95.6 ± 5.6      28          95.1 ± 5.3           .421
                    2
              Best GCS score                134         12.8 ± 3.7      45           8.5 ± 5.6          <.001
              Max pulse rate                137        123.9 ± 21.5     44         129.3 ± 26.8          .075
              Max temperature               135        100.6 ± 1.7      39          94.5 ± 16.8         <.001
              Min INR                       113         1.1 ± 0.2       30           1.3 ± 0.2          <.001
              Max INR                       113         1.5 ± 0.5       30           1.9 ± 1.0           .020
              Min hematocrit                116         29 ± 5.4        30          31.2 ± 9.4           .198
              Min platelet count            116        200.9 ± 202      30         129.2 ± 103.8         .016
              Min pH                        105         7.3 ± 0.1       29           7.2 ± 0.1           .014
              Min base deficit              104         –3 ± 7.4        29          –9.1 ± 8.4          <.001
              Max Paco                      84          44.5 ± 5.3      23          47.9 ± 5.5           .012
                      2
                                                   Blood Products Used (Mean ± SD)
              Whole blood                   137        1.77 ± 5.97      45         9.68 ± 36.21          .654
              PRBCs                         137       16.71 ± 24.55     45         41.63 ± 78.01         .191
              Platelets                     137         2.3 ± 5.04      45          12 ± 29.2            .003
              FFP                           137        10.26 ± 15.6     46         36.04 ± 77.22         .042
              Crystalloids in first 24 hours  137     5,110 ± 6,620     45        7,157 ± 10,135         .210
              Colloids in first 24 hours    137         252 ± 526       45         1,816 ± 8,341         .216
              SD = standard deviation, BP = blood pressure, GCS = Glasgow Coma Scale, Sao  = oxygen saturation, INR = international normalized ratio,
                                                                      2
              Paco  = partial pressure of carbon dioxide, PRBC = packed red blood cell, FFP = fresh frozen plasma.
                 2
                                                                                  Modern Battlefield ARDS 2003–2015  |  113