
Page 53 - JSOM Spring 2021
P. 53
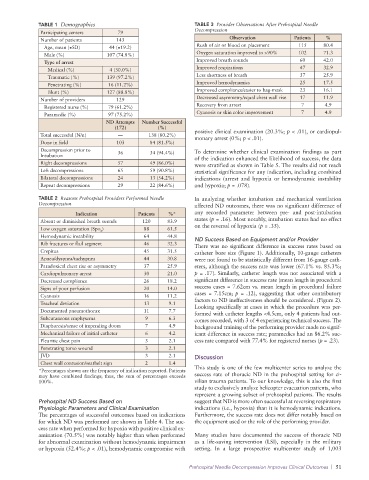
TABLE 1  Demographics                              TABLE 3  Provider Observations After Prehospital Needle
                                                                 Decompression
              Participating centers    79
              Number of patients       143                                  Observation          Patients  %
               Age, mean (±SD)       44 (±19.2)                  Rush of air or blood on placement  115    80.4
               Male (%)             107 (74.8%)                  Oxygen saturation improved to >90%  102   71.3
               Type of arrest                                    Improved breath sounds            60      42.0
                 Medical (%)         4 (30.0%)                   Improved respirations             47      32.9
                 Traumatic (%)      139 (97.2%)                  Less shortness of breath          37      25.9
                 Penetrating (%)    16 (11.2%)                   Improved hemodynamics             25      17.5
                 Blunt (%)          127 (88.8%)                  Improved compliance/easier to bag-mask  23  16.1
              Number of providers      129                       Decreased asymmetry/equal chest wall rise  17  11.9
               Registered nurse (%)  79 (61.2%)                  Recovery from arrest              7       4.9
               Paramedic (%)        97 (75.2%)                   Cyanosis or skin color improvement  7     4.9
                                    ND Attempts   Number Successful
                                       (172)         (%)
              Total successful (N/n)    —         138 (80.2%)    positive clinical examination (20.3%; p < .01), or cardiopul-
                                                                 monary arrest (0%; p < .01).
              Done in field            103        84 (81.5%)
              Decompression prior to   36         34 (94.4%)     To determine whether clinical examination findings as part
              Intubation                                         of the indication enhanced the likelihood of success, the data
              Right decompressions     57         49 (86.0%)     were stratified as shown in Table 5. The results did not reach
              Left decompressions      65         59 (90.8%)     statistical significance for any indication, including combined
              Bilateral decompressions  24        13 (54.2%)     indications (arrest and hypoxia or hemodynamic instability
              Repeat decompressions    29         22 (84.6%)     and hypoxia; p = .078).

              TABLE 2  Reasons Prehospital Providers Performed Needle   In analyzing whether intubation and mechanical ventilation
              Decompression                                      affected ND outcomes, there was no significant difference of
                          Indication          Patients  %*       any recorded parameter between pre- and post-intubation
              Absent or diminished breath sounds  120   83.9     states (p = .16). Most notably, intubation status had no effect
              Low oxygen saturation (Spo )      88      61.5     on the reversal of hypoxia (p = .35).
                                  2
              Hemodynamic instability           64      44.8     ND Success Based on Equipment and/or Provider
              Rib fractures or flail segment    46      32.3     There was no significant difference in success rates based on
              Crepitus                          45      31.5     catheter bore size (Figure 1). Additionally, 10-gauge catheters
              Apnea/dyspnea/tachypnea           44      30.8     were not found to be statistically different from 16-gauge cath-
              Paradoxical chest rise or asymmetry  37   25.9     eters, although the success rate was lower (67.1% vs. 85.3%;
              Cardiopulmonary arrest            30      21.0     p = .17). Similarly, catheter length was not associated with a
              Decreased compliance              26      18.2     significant difference in success rate (mean length in procedural
              Signs of poor perfusion           20      14.0     success cases = 7.62cm vs. mean length in procedural failure
              Cyanosis                          16      11.2     cases = 7.15cm;  p = .12), suggesting that other contributory
                                                                 factors to ND ineffectiveness should be considered. (Figure 2).
              Tracheal deviation                13      9.1      Looking specifically at cases in which the procedure was per-
              Documented pneumothorax           11      7.7      formed with catheter lengths <4.5cm, only 4 patients had out-
              Subcutaneous emphysema            9       6.3      comes recorded, with 3 of 4 experiencing technical success. The
              Diaphoresis/sense of impending doom  7    4.9      background training of the performing provider made no signif-
              Mechanical failure of initial catheter  6  4.2     icant difference in success rate; paramedics had an 86.2% suc-
              Pleuritic chest pain              3       2.1      cess rate compared with 77.4% for registered nurses (p = .23).
              Penetrating torso wound           3       2.1
              JVD                               3       2.1      Discussion
              Chest wall contusion/seatbelt sign  2     1.4
              *Percentages shown are the frequency of indication reported. Patients   This study is one of the few multicenter series to analyze the
              may have combined findings; thus, the sum of percentages exceeds   success rate of thoracic ND in the prehospital setting for ci-
              100%.                                              vilian trauma patients. To our knowledge, this is also the first
                                                                 study to exclusively analyze helicopter evacuation patients, who
                                                                 represent a growing subset of prehospital patients. The results
              Prehospital ND Success Based on                    suggest that ND is more often successful at reversing respiratory
              Physiologic Parameters and Clinical Examination    indications (i.e., hypoxia) than it is hemodynamic indications.
              The percentages of successful outcomes based on indications   Furthermore, the success rate does not differ notably based on
              for which ND was performed are shown in Table 4. The suc-  the equipment used or the role of the performing provider.
              cess rate when performed for hypoxia with positive clinical ex-
              amination (70.5%) was notably higher than when performed   Many studies have documented  the success of thoracic  ND
              for abnormal examination without hemodynamic impairment   as a life-saving intervention (LSI),  especially in the military
              or hypoxia (52.4%; p < .01), hemodynamic compromise with   setting.  In  a  large  prospective  multicenter  study  of  1,003

                                                               Prehospital Needle Decompression Improves Clinical Outcomes  |  51