
Page 128 - 2020 JSOM Winter
P. 128
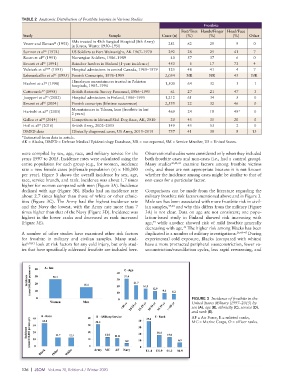
TABLE 2  Anatomic Distribution of Frostbite Injuries in Various Studies
                                                                                     Frostbite
                                                                            Feet/Toes Hands/Finger   Head/Face
           Study                              Sample                Cases (n)  (%)     (%)       (%)    Other
                               SMs treated in 48th Surgical Hospital (8th Army)
           Vester and Ekman  (1953)                                    281    62        29         9      0
                       28
                               in Korea, Winter 1950–1951
           Sumner et al  (1974)   US Soldiers at Fort Wainwright, AK 1967–1970  292  28  25       41      7
                   26
           Rosen et al  (1991)   Norwegian Soldiers, 1986–1989         40     57        37         6      0
                  29
           Ervasti et al  (1991)   Reindeer herders in Finland (1-year incidence)  453  6  17     73      4
                   36
           Valnicek et al * (1993)   Hospital admissions in central Canada, 1969–1979  125  48  41  4     7
                    30
                       31
           Lehmuskallio et al  (1995)  Finnish Conscripts, 1976–1989  2,054   NR       NR         45     NR
                               Himalayan mountaineers treated in Pakistan
           Hashmi et al  (1998)                                      1,500    64        32         3      1
                   32
                               hospitals, 1985–1994
           Cattermole  (1998)   British Antarctic Survey Personnel, 1986–1995  61  27   21        47      3
                  37
           Juopperi et al  (2002)  Hospital admissions in Finland, 1986–1995  1,212  61  34        5      0
                    33
           Ervasti et al  (2004)   Finnish conscripts (lifetime occurrence)  2,555  22  32        46      0
                   38
                               Mountaineers in Tehran, Iran (frostbite in last
                    39
           Harirchi et al  (2005)                                      469    24        18        49*     0
                               2 years)
           Gallea et al  (2014)   Competitors in Iditarod Sled Dog Race, AK, 2010  20  45  35     20      0
                  34
           Heil et al  (2016)   British Army, 2002–2015                149    45        53         2      0
                 35
           DMED data           Clinically diagnosed cases, US Army, 2015–2019  757  41  38         8     13
          *Estimated from data in article.
          AK = Alaska, DMED = Defense Medical Epidemiology Database, NR = not reported, SM = Service Member, US = United States.
          were compiled by sex, age, race, and military service for the   Observational studies were considered only when they included
          years 1997 to 2015. Incidence rates were calculated using the   both frostbite cases and non-cases (i.e., had a control group).
          entire population for each group (e.g., for women, incidence   Many studies 30,42,43  examine factors among frostbite victims
          rate = new female cases (n)/female population (n) × 100,000   only, and these are not appropriate because it is not known
          per year). Figure 3 shows the overall incidence by sex, age,   whether the incidence among cases might be similar to that of
          race, service branch, and rank. Incidence was about 1.7 times   non-cases for a particular factor.
          higher for women compared with men (Figure 3A). Incidence
          declined with age (Figure 3B). Blacks had an incidence rate   Comparisons can be made from the literature regarding the
          about 2.7 times higher than those of white or other ethnic-  military frostbite risk factors mentioned above and in Figure 3.
          ities (Figure 3C). The Army had the highest incidence rate   Male sex has been associated with more frostbite risk in civil-
          and the Navy the lowest, with the Army rate more than 7   ian samples, 33,44  and why this differs from the military (Figure
          times higher than that of the Navy (Figure 3D). Incidence was   3A) is not clear. Data on age are not consistent; one popu-
          highest in the lower ranks and decreased as rank increased    lation-based study in Finland showed risk increasing with
          (Figure 3E).                                       age,  while another showed risk of mild frostbite generally
                                                                33
                                                             decreasing with age.  The higher risk among Blacks has been
                                                                             44
          A number of other studies have examined other risk factors   duplicated in a number of military investigations. 26,45–47  During
          for frostbite in military and civilian samples. Many stud-  experimental cold exposure, Blacks (compared with whites)
          ies 6,40,41  look at risk factors for any cold injury, but only stud-  have a more protracted peripheral vasoconstriction, fewer va-
          ies that have specifically addressed frostbite are included here.   soconstriction/vasodilation cycles, less rapid rewarming, and


                                                                                FIGURE 3  Incidence of frostbite in the
                                                                                United States Military (1997–2015) by
                                                                                sex (A), age (B), ethnicity (C), service (D),
                                                                                and rank (E).
                                                                                AF = Air Force, E = enlisted ranks,
                                                                                MC = Marine Corps, O = officer ranks.


          126  |  JSOM   Volume 20, Edition 4 / Winter 2020