
Page 75 - JSOM Fall 2020
P. 75
Texas Willed Body Program and the III Corps Surgeon Cell. for a total of 240 scans were required to achieve an effect size
Cadavers 1 and 2 were intubated with the endotracheal tube of 10%, with an α < 0.05 and a 95% confidence interval.
placed in the right mainstem. A posterior thoracotomy inci-
sion was done on cadaver 3 and the right main stem bronchus Results
was clamped with a curved hemostat, eliminating lung-sliding,
thereby creating sonographic findings of PTX. Cadavers were A total of 47 US Army combat medics met screening crite-
then ventilated manually with a bag-valve mask. U/S images of ria. Following randomization, four participants randomized
all hemithoraces were validated by an U/S fellowship-trained to the blended cohort were lost to competing duty require-
emergency medicine physician prior to data collection. Both ments prior to testing, leaving 24 in the didactic-only cohort
sliding lung sign and seashore sign were verified in the three and 19 in the blended cohort. They examined a total of 258
normal lungs and absence of those signs were verified in the hemithoraces. Overall sensitivity and specificity for detection
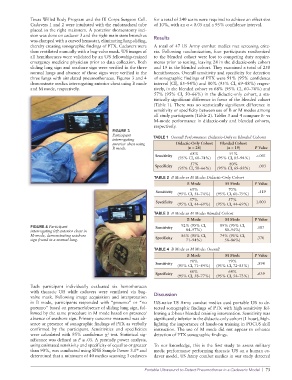
three lungs with simulated pneumothoraces. Figures 3 and 4 of sonographic findings of PTX were 91% (95% confidence
demonstrate medics interrogating anterior chest using B mode interval [CI], 85–94%) and 80% (95% CI, 69–88%) respec-
and M mode, respectively. tively, in the blended cohort vs 68% (95% CI, 60–74%) and
57% (95% CI, 50–66%) in the didactic-only cohort, a sta-
tistically significant difference in favor of the blended cohort
(Table 1). There was no statistically significant difference in
sensitivity or specificity between use of B or M modes among
all study participants (Table 2). Tables 3 and 4 compare B- vs
M-mode performance in didactic-only and blended cohorts,
respectively.
FIGURE 3
Participant TABLE 1 Overall Performance: Didactic-Only vs Blended Cohorts
interrogating
anterior chest using Didactic-Only Cohort Blended Cohort
B mode. (n = 24) (n = 19) P Value
68% 91%
Sensitivity (95% CI, 60–74%) (95% CI, 85–94%) <.001
57% 80%
Specificity .003
(95% CI, 50–66%) (95% CI, 69–88%)
TABLE 2 B Mode vs M Mode: Didactic-Only Cohort
B Mode M Mode P Value
65% 70%
Sensitivity .519
(95% CI, 54–74%) (95% CI, 60–79%)
57% 57%
Specificity 1.000
(95% CI, 44–69%) (95% CI, 44–69%)
TABLE 3 B Mode vs M Mode: Blended Cohort
B Mode M Mode P Value
FIGURE 4 Participant Sensitivity 92% (95% CI, 89% (95% CI, .587
interrogating left anterior chest in 84–97%) 80–94%)
M-mode, demonstrating seashore 86% (95% CI, 74% (95% CI,
sign found in a normal lung. Specificity 71–94%) 58–86%) .370
TABLE 4 B Mode vs M Mode: Overall
B Mode M Mode P Value
78% 79%
Sensitivity .894
(95% CI, 71–84%) (95% CI, 72–85%)
68% 64%
Specificity .639
(95% CI, 58–77%) (95% CI, 54–73%)
Each participant individually evaluated six hemothoraces
with thoracic U/S while cadavers were ventilated via bag-
valve mask. Following image acquisition and interpretation Discussion
in B mode, participants responded with “pneumo” or “no U/S-naive US Army combat medics used portable U/S to de-
pneumo” based on presence/absence of sliding lung sign, fol- tected sonographic findings of PTX with high sensitivity fol-
lowed by the same procedure in M mode based on presence/ lowing a 2-hour blended training intervention. Sensitivity was
absence of seashore sign. Primary outcome measured was ab- significantly inferior in the didactic-only cohort (1 hour), high-
sence or presence of sonographic findings of PTX as verbally lighting the importance of hands-on training in POCUS skill
confirmed by the participant. Sensitivities and specificities instruction. The use of M mode did not appear to enhance
were calculated with 95% confidence χ test. Statistical sig- detection of PTX sonographic findings.
2
nificance was defined as P ≤ .05. A prestudy power analysis,
using estimated sensitivity and specificity of equal to or greater To our knowledge, this is the first study to assess military
than 90%, was conducted using SPSS Sample Power 3.0 and medic performance performing thoracic U/S on a human ca-
®
determined that a minimum of 40 medics scanning 3 cadavers daver model. US Army combat medics in our study detected
Portable Ultrasound to Detect Pneumothorax in a Cadaveric Model | 73