
Page 130 - JSOM Summer 2020
P. 130
operational field environment must also be readily available reduction; 2 = 51%–75% contamination reduction; 3 = > 75%
through established supply chains or portable to the field with contamination reduction. No score discrepancies > 1 were ob-
the handler’s standard canine gear. Therefore, the objective of served between reviewers.
this multiphase study was to test the effect of material type,
cleanser, and method of cleaning on contaminant reduction of Phase 2
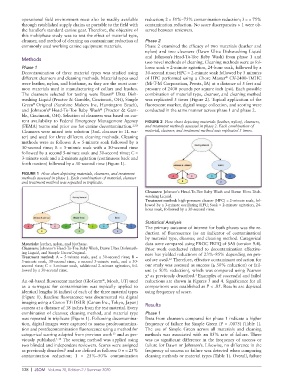
commonly used working canine equipment materials. Phase 2 examined the efficacy of two materials (leather and
nylon) and two cleansers (Dawn Ultra Dishwashing Liquid
and Johnson’s Head-To-Toe Baby Wash) from phase 1 and
Methods
two novel methods of cleaning. Cleaning methods were as fol-
Phase 1 lows: soak = 2-minute agitation, 24-hour soak, followed by a
Decontamination of three material types was studied using 30-second rinse; HPC = 2-minute soak followed by 3 minutes
different cleansers and cleaning methods. Material types used of HPC performed using a Chore Master CV-2400-1MHC
®
were leather, nylon, and biothane, as they are the most com- (Mi-T-M Corporation, Peosta, IA) at a distance of 5 feet and
mon materials used in manufacturing of collars and leashes. pressure of 2400 pounds per square inch (psi). Each possible
The cleansers selected for testing were Dawn Ultra Dish- combination of material type, cleanser, and cleaning method
®
washing Liquid (Proctor & Gamble, Cincinnati, OH), Simple was replicated 5 times (Figure 2). Topical application of the
Green Original (Sunshine Makers Inc, Huntington Beach), fluorescent marker, digital image collection, and scoring were
®
and Johnson’s Head-To-Toe Baby Wash (Proctor & Gam- conducted in the same manner across phase 1 and phase 2.
®
®
ble, Cincinnati, OH). Selection of cleansers was based on cur-
rent availability to Federal Emergency Management Agency FIGURE 2 Flow chart depicting materials (leather, nylon), cleansers,
(FEMA) teams and prior use for canine decontamination. 1,2,8 and treatment methods assessed in phase 2. Each combination of
Cleansers were mixed into solution (3mL cleanser to 1L wa- material, cleanser, and treatment method was replicated 5 times.
ter) and used for three different cleaning methods. Cleaning
methods were as follows: A = 5-minute soak followed by a
30-second rinse; B = 5-minute soak with a 30-second rinse
followed by a second 5-minute soak and 30-second rinse; C =
3-minute soak and a 2-minute agitation (continuous back and
forth motion) followed by a 30-second rinse (Figure 1).
FIGURE 1 Flow chart depicting materials, cleansers, and treatment
methods assessed in phase 1. Each combination of material, cleanser
and treatment method was repeated in triplicate.
Cleansers: Johnson’s Head-To-Toe Baby Wash and Dawn Ultra Dish-
washing Liquid.
Treatment method: high-pressure cleaner (HPC) = 2-minute soak, fol-
lowed by a 3-minute oscillating HPC; Soak = 2-minute agitation, 24-
hour soak, followed by a 30-second rinse.
Statistical Analysis
The primary outcome of interest for both phases was the re-
duction of fluorescence (as an indicator of contamination)
by material type, cleanser, and cleaning method. Categorical
Materials: leather, nylon, and biothane. data were compared using PROC FREQ of SAS (version 9.4).
Cleansers: Johnson’s Head-To-Toe Baby Wash, Dawn Ultra Dishwash- Prior work conducted related to decontamination effective-
ing Liquid, and Simple Green Original. ness has yielded reductions of 23%–85% depending on pro-
Treatment method: A = 5-minute soak, and a 30-second rinse; B = cedure used. Therefore, effective contaminant reduction for
12
5-minute soak, 30-second rinse, a second 5-minute soak, and a 30-
second rinse; C = 3-minute soak, additional 2-minute agitation, fol- our study was assessed as success (≥ 50% reduction) or fail-
lowed by a 30-second rinse. ure (< 50% reduction), which was compared using Pearson
χ as previously described. Examples of successful and failed
1
2
An oil-based fluorescent marker (GloGerm , Moab, UT) used reductions are shown in Figures 3 and 4. Significance for all
®
as a surrogate for contamination was topically applied to comparisons was established at P < .05. Results are depicted
identical lengths (6 inches) of each of the three material types using frequency of score.
(Figure 1). Baseline fluorescence was documented via digital
imaging using a Canon T5i DSLR (Canon Inc., Tokyo, Japan) Results
camera at a distance of 18 inches from the test material. Every
combination of cleanser, cleaning method, and material type Phase 1
was repeated in triplicate (Figure 1). Following decontamina- Data from cleansers compared for phase 1 indicate a higher
tion, digital images were captured to assess predecontamina- frequency of failure for Simple Green (P = .0075) (Table 1).
tion and postdecontamination fluorescence using a method for The use of Simple Green across all materials and cleaning
categorical scoring adapted from previous work and as pre- methods was associated with an 85% rate of failure. There
13
viously published. 1,14 The scoring method was applied using was no significant difference in the frequency of success or
two blinded and independent reviewers. Scores were assigned failure for Dawn or Johnson’s. Likewise, no difference in the
as previously described and are defined as follows: 0 = < 25% frequency of success or failure was detected when comparing
1
contamination reduction; 1 = 25%–50% contamination cleaning methods or material types (Table 1). Overall, failure
128 | JSOM Volume 20, Edition 2 / Summer 2020