
Page 27 - Journal of Special Operations Medicine - Winter 2016
P. 27
fit the data (y = −bx + a), and were associated with a Table 3 Hypotheses Generated
trend line that nearly overlaid the zero line (x axis; Fig- Trainee learning curves vary (e.g., flat, curved) by the
ure 4). The slope of the line (−b) was small in that the chosen metric (e.g., time, effectiveness).
flatness of the line indicated little to no learning. In this Use of >1 metric assesses learning more comprehensively
case, the experienced user tended to use fewer turns as but takes more assessment time.
experience increased, so there was a small downward There is interinstructor variability in awareness of
(negative) slope to the trend line. differential utility between metrics.
Results of One Parameter as a Difference Number of uses differs by instructional goal (e.g., expertise,
competence threshold: go or no-go).
Between Two Users With One Tourniquet Model
Our fifth evaluation again considered differences be- A proportion of learning is associated with the increases in
experience.
tween users, but this time, the difference in time to
effectiveness, was analyzed. The difference in time to ef-
fectiveness was sought to assess when a less experienced same basic design (i.e., strap-and-windlass design), are
user became as fast as the more experienced user. In this similarly familiar to users (e.g., military services who use
study, because the more experienced user was an expert, them), and are recommended for Tactical Combat Ca-
this evaluation was a measure of how long it took for sualty Care (TCCC). However, the RMT has a ratchet
a less experienced user to become expert. Again, the design, is less familiar to users, and has not been recom-
C-A-T was assessed, and the expert’s time was subtracted mended for TCCC. The order of testing for this study
from the less experienced user’s time. The trend line of was C-A-T, SOFTT-W, and then RMT, and may have
the difference was linear, with a calculated x-axis inter- affected the results because the SOFTT-W may have
cept of 101 that represented the use number associated benefited from user learning afforded by prior C-A-T
with the less experienced user achieving expert status, use. The start point of the SOFTT-W trend line over-
because that was when performance equaled that of the laid the C-A-T’s start point, and this may indicate that
expert (Figure 5; Table 2). The threshold of nearly 100 the learning curves for the SOFTT-W and C-A-T started
was measured for both of the two continuous parameter similarly. However, the trend lines immediately diverged
(time and blood loss), and a threshold of 1 was measured to favor use of the C-A-T although the user was more
for the binary parameter of effectiveness (yes-no). experienced when using the SOFTT-W. If the user had
no learning before using the SOFTT-W, then perfor-
mance with the SOFTT-W may have been worse than
Discussion
what is indicated in Figure 3. The learning curve for us-
The main finding of this study is that preliminary explo- ing the RMT, despite its dissimilar design, started well
ration of emergency-tourniquet users’ learning curves but crossed over the C-A-T trend line.
yielded opportunities for additional learning by generat-
ing and testing hypotheses (Table 3). Tourniquet users When comparing the number of turns users made in
generated their own data of learning, which was then tightening the tourniquets that had a windlass, the more
recorded, and instructors might plausibly use such data experienced user may have understood the role of slack
to better understand the performance of trainees. removal better before turning the windlass, so slack re-
moval may have differed a bit between users. The find-
Some of our intriguing results require further examina- ings of nearly no difference indicated that users may
tion. The similarity of the learning curves for the C-A-T vary little in terms of windlass turn number when they
and SOFTT-W may be expected because they have the are properly trained, as they were in this case. Because
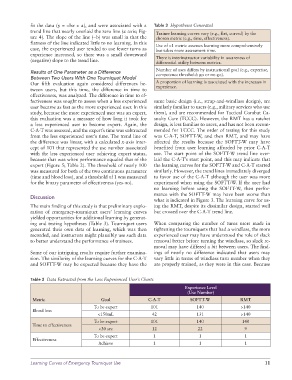
Table 2 Data Extracted from the Less Experienced User’s Charts
Experience Level
(Use Number)
Metric Goal C-A-T SOFTT-W RMT
To be expert 101 140 >140
Blood loss
<150mL 42 131 >140
To be expert 101 140 140
Time to effectiveness
<30 sec 12 22 9
To be expert 1 1 1
Effectiveness
Achieve 1 1 1
Learning Curves of Emergency Tourniquet Use 11