
Page 25 - Journal of Special Operations Medicine - Winter 2016
P. 25
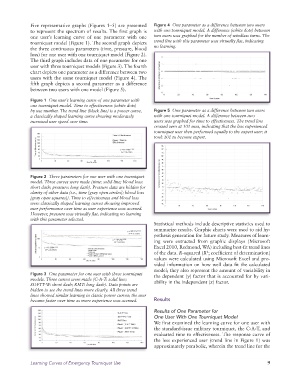
Five representative graphs (Figures 1–5) are presented   Figure 4  One parameter as a difference between two users
              to represent the spectrum of results. The first graph is   with one tourniquet model. A difference (white dots) between
              one user’s learning curve of one parameter with one   two users was graphed for the number of windlass turns. The
              tourniquet model (Figure 1). The second graph depicts   trend line with this parameter was virtually flat, indicating
              the three continuous parameters (time, pressure, blood   no learning.
              loss) for one user with one tourniquet model (Figure 2).
              The third graph includes data of one parameter for one
              user with three tourniquet models (Figure 3). The fourth
              chart depicts one parameter as a difference  between two
              users with the same tourniquet model (Figure 4). The
              fifth graph depicts a second parameter as a difference
              between two users with one model (Figure 5).

              Figure 1  One user’s learning curve of one parameter with
              one tourniquet model. Time to effectiveness (white dots)
              by use number. The trend line (black line) is a power curve,   Figure 5  One parameter as a difference between two users
              a classically shaped learning curve showing moderately   with one tourniquet model. A difference between two
              increased user speed over time.                    users was graphed for time to effectiveness. The trend line
                                                                 crossed zero at 101 uses, indicating that the less experienced
                                                                 tourniquet user then performed equally to the expert user; it
                                                                 took 101 to become expert.


              Figure 2  Three parameters for one user with one tourniquet
              model. Three curves were made (time: solid line; blood loss:
              short dash; pressure: long dash). Pressure data are hidden for
              clarity of other data (i.e., time [gray open circles]; blood loss
              [gray open squares]). Time to effectiveness and blood loss
              were classically shaped learning curves showing improved
              user performance over time as user experience was accrued.
              However, pressure was virtually flat, indicating no learning
              with this parameter selected.
                                                                 Statistical methods include descriptive statistics used to
                                                                 summarize results. Graphic charts were used to aid hy-
                                                                 pothesis generation for future study. Measures of learn-
                                                                 ing were extracted from graphic displays (Microsoft
                                                                 Excel 2010, Redmond, WA) including best-fit trend lines
                                                                                      2
                                                                 of the data. R-squared (R ; coefficient of determination)
                                                                 values were calculated using Microsoft Excel and pro-
                                                                 vided information on how well data fit the calculated
                                                                 model; they also represent the amount of variability in
              Figure 3  One parameter for one user with three tourniquet   the dependent (y) factor that is accounted for by vari-
              models. Three curves were made (C-A-T: solid line;   ability in the independent (x) factor.
              SOFTT-W: short dash; RMT: long dash). Data points are
              hidden to see the trend lines more clearly. All three trend
              lines showed similar learning in classic power curves; the user
              became faster over time as more experience was accrued.  Results
                                                                 Results of One Parameter for
                                                                 One User With One Tourniquet Model
                                                                 We first examined the learning curve for one user with
                                                                 the standard-issue military tourniquet, the C-A-T, and
                                                                 evaluated time to effectiveness. The response curve of
                                                                 the less experienced user (trend line in Figure 1) was
                                                                 approximately parabolic, wherein the trend line for the


              Learning Curves of Emergency Tourniquet Use                                                      9