
Page 26 - Journal of Special Operations Medicine - Winter 2016
P. 26
data points sloped downward in a curve that flattened in Figure 1. The blood-loss learning curve was similar
out as use number increased. The data were best fit by to that of time to effectiveness, because both curves had
an exponential equation (y = 61.868x −0.295 ), in which similar characteristics (i.e., exponents and R values).
2
61.868 represents the calculated time to effectiveness The learning curve for pressure was almost flat, with an
at use number 0 (i.e., before any uses of tourniquets). exponent and R that differed from those of the time to
2
The use number, a measure of experience, was thus as- effectiveness and blood loss curves.
sociated with time to tourniquet effectiveness. This effec-
tiveness time-use number association had an R of 0.72, Results of One Parameter for
2
indicating that 72% of the variability of time to effec- One User With Three Tourniquet Models
tiveness was associated with the increases in use number. For an additional analysis of the learning curve pre-
The amount of learning for this user can be expressed as sented in Figure 1 with the C-A-T, we added two other
a number, the difference of the trend line’s first value mi- tourniquet models to assess whether learning curves
nus its last is 62 – 16 = 46 seconds (Table 1). The results, varied by model (Figure 3). The learning curve for time
such as the exponent values of −0.308 to −0.073 for the to effectiveness for the C-A-T includes the same data as
efficacy-related parameters, blood loss and time, indicate in Figure 1, and intermodel comparisons indicated that
faster learning rates as measured, while the exponent val- the other two models showed similar results.
ues of −0.017 to 0.282 for the safety-related parameter,
pressure, indicate slower learning rates. Results of One Parameter as a Difference
Between Two Users With One Tourniquet Model
Results of Three Parameters for The fourth evaluation considered the difference (less
One User With One Tourniquet Model experienced user minus the more experienced user) in
We further examined the learning curve for the user the number of turns users made in tightening the tour-
with the C-A-T (Figure 1), but we added pressure and niquets that had a windlass; the C-A-T was the model
blood loss parameters to assess whether learning curves assessed. The difference was plotted by use number to
varied by the parameter selected (Figure 2). The learning explore for trends. Calculated differences were often
curve for time to effectiveness includes the same data as zero, could be described by a linear equation that best
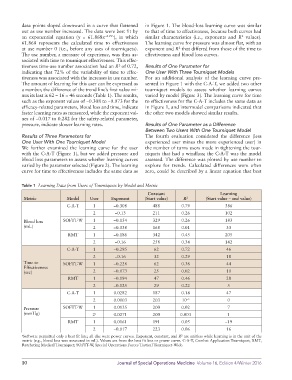
Table 1 Learning Data from Users of Tourniquets by Model and Metric
Constant Learning
Metric Model User Exponent (Start value) R 2 (Start value − end value)
C-A-T 1 −0.308 488 0.79 386
2 −0.13 211 0.26 102
Blood loss SOFTT-W 1 −0.154 329 0.26 183
(mL) 2 −0.038 168 0.01 33
RMT 1 −0.186 342 0.45 205
2 −0.16 258 0.34 142
C-A-T 1 −0.295 62 0.72 46
2 −0.16 32 0.29 18
Time to SOFTT-W 1 −0.228 62 0.36 44
Effectiveness
(sec) 2 −0.073 25 0.02 10
RMT 1 −0.194 47 0.46 28
2 −0.125 29 0.22 5
C-A-T 1 0.0282 187 0.18 47
2 0.0003 203 10 −5 0
Pressure SOFTT-W 1 0.0135 200 0.02 7
(mmHg) 2 a 0.0271 200 0.003 1
RMT 1 0.0161 191 0.05 −19
2 −0.017 223 0.06 16
a Software permitted only a best fit line; all else were power curves. Exponent, constant, and R are unitless while learning is in the unit of the
2
metric (e.g., blood loss was measured in mL). Values are from the best fit line or power curve. C-A-T, Combat Application Tourniquet; RMT,
Ratcheting Medical Tourniquet; SOFTT-W, Special Operations Forces Tactical Tourniquet-Wide.
10 Journal of Special Operations Medicine Volume 16, Edition 4/Winter 2016