
Page 48 - Journal of Special Operations Medicine - Spring 2016
P. 48
reported. For pairwise comparison of models, a non- Table 2 Distal Pulse Cessation Results by Tourniquet Model*
parametric Wilcoxon method was used. For pairwise Pulse Cessation,**
comparison of model means, the Tukey method was Occurrence, No. (%)
†
used. Significance for results was established when p < Tourniquet Model No Yes
.05. All statistical analysis was conducted using SAS soft-
ware (SAS Institute; https://www.sas.com) and MS Excel C-A-T (n = 20) 0 (0) 20 (100)
2003 (Microsoft Corp.; http://www.microsoft.com). RATS (n = 20) 0 (0) 20 (100)
TMT (n = 20) 1 (5) 19 (95)
Total (N = 60) 1 (2) 59 (98)
Results
*Chi-square analysis found no differences among tourniquets (p >
.05). **Pulse cessation was defined by absence of measurable pulse
Tourniquet Model Comparisons (no/yes). Percentage was calculated by dividing occurrences for each
†
Neither tourniquet effectiveness (p = .10) (Table 1) nor column (no/yes) by total occurrences and multiplying by 100.
pulse cessation (p = .33) (Table 2) differed among tour-
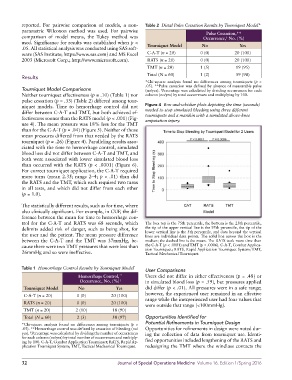
niquet models. Time to hemorrhage control did not Figure 4 Box-and-whisker plots depicting the time (seconds)
differ between C-A-T and TMT, but both achieved ef- needed to stop simulated bleeding using three different
tourniquets and a manikin with a simulated above-knee
fectiveness sooner than the RATS model (p < .001) (Fig- amputation injury.
ure 4). The mean pressure was 18% less for the TMT
than for the C-A-T (p = .04) (Figure 5). Neither of those
mean pressures differed from that needed by the RATS
tourniquet (p ≥ .26) (Figure 4). Paralleling results asso-
ciated with the time to hemorrhage control, simulated
blood loss did not differ between C-A-T and TMT, and
both were associated with lower simulated blood loss
than occurred with the RATS (p < .0001) (Figure 6).
For correct tourniquet application, the C-A-T required
more turns (mean 2.35; range 2–4; p < .01) than did
the RATS and the TMT, which each required two turns
in all tests, and which did not differ from each other
(p = 1.0).
The statistically different results, such as for time, where
also clinically significant. For example, in CUF, the dif-
ference between the mean for time to hemorrhage con-
trol for the C-A-T and RATS was 68 seconds, which The box top is the 75th percentile, the bottom is the 25th percentile,
delimits added risk of danger, such as being shot, for the tip of the upper vertical line is the 95th percentile, the tip of the
the user and the patient. The mean pressure difference lower vertical line is the 5th percentile, and dots beyond the vertical
lines are individual data points. The solid line across the box is the
between the C-A-T and the TMT was 37mmHg, be- median; the dashed line is the mean. The RATS took more time than
cause there were two TMT pressures that were less than the C-A-T (p < .0001) and TMT (p = .0006). C-A-T, Combat Applica-
26mmHg and so were ineffective. tion Tourniquet; RATS, Rapid Application Tourniquet System; TMT,
Tactical Mechanical Tourniquet.
Table 1 Hemorrhage Control Results by Tourniquet Model *
User Comparisons
Hemorrhage Control, ** Users did not differ in either effectiveness (p = .48) or
Occurrence, No. (%) † in simulated blood loss (p = .59), but pressures applied
Tourniquet Model No Yes did differ (p < .01). All pressures were in a safe range;
C-A-T (n = 20) 0 (0) 20 (100) however, the experienced user remained in an effective
range while the inexperienced user had four values that
RATS (n = 20) 0 (0) 20 (100)
were outside that range (<100mmHg).
TMT (n = 20) 2 (10) 18 (90)
Total (N = 60) 2 (3) 58 (97) Opportunities Identified for
*Chi-square analysis found no differences among tourniquets (p > Potential Refinements in Tourniquet Design
.05). **Hemorrhage control was defined by cessation of bleeding (no/ Opportunities for refinements in design were noted dur-
yes). Percentage was calculated by dividing the number of occurrences ing the collection of data from tourniquet use. Identi-
†
for each column (no/yes) by total number of occurrences and multiply-
ing by 100. C-A-T, Combat Application Tourniquet; RATS, Rapid Ap- fied opportunities included lengthening of the RATS and
plication Tourniquet System; TMT, Tactical Mechanical Tourniquet. redesigning the TMT where the windlass contacts the
32 Journal of Special Operations Medicine Volume 16, Edition 1/Spring 2016