
Page 35 - Journal of Special Operations Medicine - Winter 2015
P. 35
Descriptive statistics were used to portray results. Cat- Table 2 Pulse Cessation Results by Tourniquet Group
egorical data (effectiveness and pulse cessation in 2 × 2 Pulse Cessation,* No. (%)
or 2 × 3 contingency tables) were analyzed with a chi- Tourniquet
square test and its likelihood ratio was reported with Type No Yes Sum
p-values. For pairwise comparison of group percentages CAT 0 (0) 20 (100) 20
for categorical data, a nonparametric Wilcoxon method Bandage 11 (55) 9 (45) 20
was used. Statistical testing included analysis of vari- Bandana 18 (90) 2 (10) 20
ance to see if any group result was different from results
of the other groups. For pairwise comparison of group Sum 29 (48) 31 (52) 60
means, the Tukey-Kramer Honestly Significant Dif-
ference method was used. Significance for results was Time of Application Results by Tourniquet Group
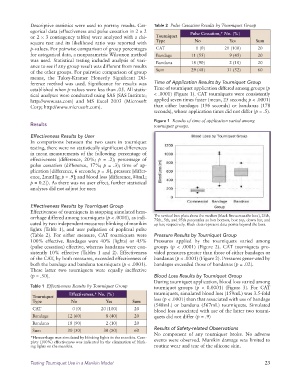
established when p-values were less than .05. All statis- Time of tourniquet application differed among groups (p
tical analyses were conducted using SAS (SAS Institute; < .0001) (Figure 1). CAT tourniquets were consistently
http://www.sas.com) and MS Excel 2003 (Microsoft applied seven times faster (mean, 25 seconds; p < .0001)
Corp; http://www.microsoft.com). than either bandages (196 seconds) or bandanas (178
seconds), whose application times did not differ (p = .5).
Figure 1 Results of time of application varied among
Results tourniquet groups.
Effectiveness Results by User
In comparisons between the two users in tourniquet
testing, there were no statistically significant differences
in mean measurements of the following: percentage of
effectiveness (difference, 20%; p = .2); percentage of
pulse cessation (difference, 17%; p = .3); time of ap-
plication [difference, 6 seconds; p = .8], pressure [differ-
ence, 2mmHg; p = .9]; and blood loss [difference, 80mL;
p = 0.2]). As there was no user effect, further statistical
analyses did not adjust for user.
Effectiveness Results by Tourniquet Group
Effectiveness of tourniquets in stopping simulated hem-
orrhage differed among tourniquets (p < .0001), as indi- The vertical box plots show the median (black line across the box), 25th,
75th, 5th, and 95th percentiles as box bottom, box top, down bar, and
cated by two independent measures: blinking of manikin up bar, respectively. Black dots represent data points beyond the bars.
lights (Table 1), and user palpation of popliteal pulse
(Table 2). For either measure, CAT tourniquets were Pressure Results by Tourniquet Group
100% effective. Bandages were 40% (lights) or 45% Pressures applied by the tourniquets varied among
(pulse cessation) effective, whereas bandanas were con- groups (p < .0001) (Figure 2). CAT tourniquets pro-
sistently 10% effective (Tables 1 and 2). Effectiveness vided pressures greater than those of either bandages or
of the CAT, by both measures, exceeded effectiveness of bandanas (p < .0001) (Figure 2). Pressures gener-ated by
both the bandage and bandana tourniquets (p < .0001). bandages exceeded those of bandanas (p = .02).
These latter two tourniquets were equally ineffective
(p = .50). Blood Loss Results by Tourniquet Group
During tourniquet application, blood loss varied among
Table 1 Effectiveness Results by Tourniquet Group tourniquet groups (p < 0.0001) (Figure 3). For CAT
Effectiveness,* No. (%) tourniquets, simulated blood loss (159mL) was 3.5-fold
Tourniquet
Type No Yes Sum less (p < .0001) than that associated with use of bandage
CAT 0 (0) 20 (100) 20 (548mL) or bandana (567mL) tourniquets. Simulated
blood loss associated with use of the latter two tourni-
Bandage 12 (60) 8 (40) 20 quets did not differ (p = .9)
Bandana 18 (90) 2 (10) 20
Sum 30 (50) 30 (50) 60 Results of Safetyrelated Observations
*Hemorrhage was simulated by blinking lights in the manikin. Com- No component of any tourniquet broke. No adverse
plete (100%) effectiveness was indicated by the elimination of blink- events were observed. Manikin damage was limited to
ing lights on the manikin. routine wear and tear of the silicone skin.
Testing Tourniquet Use in a Manikin Model 23