
Page 137 - Journal of Special Operations Medicine - Summer 2015
P. 137
strategic level of leadership seems to be overlooked in histories, and tactical metrics, which fed more directly
the RAND report. In addition to adding an “advocacy into the TSOCs/military measures of effectiveness. Next
phase,” the diagram depicting level of effort could be are samples of actual metrics used or presented relative to
improved by adding a line that reflects leadership effort the generic metrics recommended in the RAND report:
needed throughout the phases. A high level of support
and involvement on leadership’s part is critical to facili- RAND Metric 1: Level of need for effort
tating the success and sustainability of capacity building.
Program Metric 1: The level of need was measured as
high. Niger is a vast country with limited paved roads
Measures of Effectiveness
connecting the country’s capital and principal center of
As noted in the RAND report, it is imperative that both referral medical services to the outlying regions. At the
efficiency and effectiveness be measured. For efficiency start of the program, there was no organized system
reporting, the Office of the Secretary of Defense (OSD) for moving patients or evacuating military or civilian
required data on the number of US personnel involved, casualties. Patients were spending days in overland
number of days on temporary duty (TDY), mission bud- convoys to reach Niamey without medical attendants
gets, and number of partner nation personnel trained. in some cases. The program metric: Increase in the
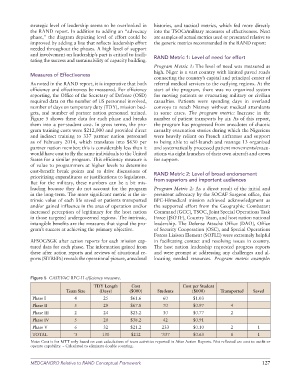
Figure 5 shows these data for each phase and breaks number of patient transports by air. As of this report,
them into a per-student cost. In gross terms, the pro- the program has progressed from anecdotes of chaotic
gram training costs were $212,000 and provided direct casualty evacuation stories during which the Nigeriens
and indirect training to 337 partner nation personnel were heavily reliant on French airframes and support
as of February 2014, which translates into $630 per to being able to self-launch and manage 13 organized
partner nation member; this is considerably less than it and systematically processed patient movements/evacu-
would have cost to fly the same individuals to the United ations via eight launches of their own aircraft and crews
States for a similar program. This efficiency measure is for support.
of value to programmers at higher levels to determine
cost-benefit break points and to drive discussions of RAND Metric 2: Level of broad endorsement
prioritizing expenditures or justifications to legislators. from superiors and important audiences
But for the military, these numbers can be a bit mis-
leading because they do not account for the program Program Metric 2: As a direct result of the initial and
in the long-term. The more significant metric is the in- persistent advocacy by the SOCAF Surgeon office, this
trinsic value of each life saved or patients transported BPC-H/medical mission achieved acknowledgment as
and/or gained influence in the area of operation and/or the supported effort from the Geographic Combatant
increased perception of legitimacy for the host nation Command (GCC), TSOC, Joint Special Operations Task
in those targeted undergoverned regions. The intrinsic, Force (JSOTF), Country Team, and host nation national
intangible benefits are the measures that signal the pro- leadership. The Defense Attaché Office (DAO), Office
gram’s success at achieving the primary objective. of Security Cooperation (OSC), and Special Operations
Forces Liaison Element (SOFLE) were extremely helpful
AFSOC/SGK after action reports for each mission cap- in facilitating contact and resolving issues in country.
tured data for each phase. The information gained from The host nation leadership requested progress reports
these after action reports and reviews of situational re- and were prompt at addressing any challenges and al-
ports (SITREPs) reveals the operational picture, anecdotal locating needed resources. Program metric example:
Figure 5 CASEVAC BPC-H efficiency measure.
TDY Length Cost Cost per Student
Team Size (Days) ($000) Students ($000) Transported Saved
Phase I 4 25 $61.6 60 $1.03
Phase II 5 29 $67.8 70 $0.97 4
Phase III 2 24 $23.2 30 $0.77 2
Phase IV 5 20 $38.2 42 $0.91
Phase V 6 32 $21.2 233 $0.10 2 1
TOTAL ˜5 130 $212 ˜337 $0.63 8 1
Note: Cost is for MTT only based on cost calculations of team activities reported in After Action Reports. Not reflected are cost to outfit or
operate capability. ~ Calculated to eliminate double counting.
MEDCANGRO Relative to RAND Conceptual Framework 127