
Page 45 - Journal of Special Operations Medicine - Spring 2015
P. 45
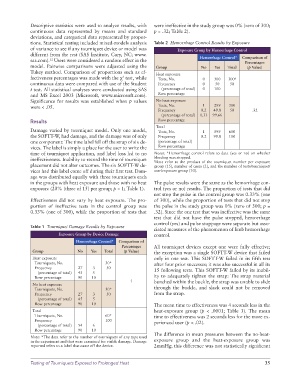
Descriptive statistics were used to analyze results, with were ineffective in the study group was 0% (zero of 300;
continuous data represented by means and standard p = .32; Table 2).
deviations, and categorical data represented by propor
tions. Statistical testing included mixedmodels analysis Table 2 Hemorrhage Control Results by Exposure
of variance to see if any tourniquet device or model was Exposure Group by Hemorrhage Control
different from the rest (SAS Institute, Cary, NC; www.
sas.com). Users were considered a random effect in the Hemorrhage Control* Comparison of
12
Percentages
model. Pairwise comparisons were adjusted using the Group No Yes Total (p Value)
Tukey method. Comparison of proportions such as ef Heat exposure
fectiveness percentages was made with the χ test, while Tests, No. 0 300 300 †
2
continuous data were compared with use of the Student Frequency 0 50 50
t test. All statistical analyses were conducted using SAS (percentage of total) 0 100
and MS Excel 2003 (Microsoft, www.microsoft.com). Row percentage
Significance for results was established when p values No heat exposure
were < .05. Tests, No. 1 299 300
Frequency 0.2 49.8 50 .32
(percentage of total) 0.33 99.66
Results Row percentage
Total
Damage varied by tourniquet model. Only one model, Tests, No. 1 599 600
the SOFTTW, had damage, and the damage was of only Frequency 0.2 99.8 100
one component: The time label fell off the strap of six de (percentage of total)
vices. The label is simply a place for the user to write the Row percentage
time of tourniquet application, and label loss led to no Notes: *Hemorrhage control refers to data (yes or no) on whether
ineffectiveness. Inability to record the time of tourniquet bleeding was stopped.
Data refer to the product of the tourniquet number per exposure
†
placement did not alter outcomes. The six SOFTTW de group (15), number of users (2), and the number of tests/tourniquet/
vices had this label come off during their first test. Dam user/exposure group (10).
age was distributed equally with three tourniquets each
in the groups with heat exposure and those with no heat The pulse results were the same as the hemorrhage con
exposure (20% [three of 15] per group; p = 1; Table 1). trol (yes or no) results. The proportion of tests that did
not stop the pulse in the control group was 0.33% (one
Effectiveness did not vary by heat exposure. The pro of 300), while the proportion of tests that did not stop
portion of ineffective tests in the control group was the pulse in the study group was 0% (zero of 300; p =
0.33% (one of 300), while the proportion of tests that .32). Since the one test that was ineffective was the same
test that did not have the pulse stopped, hemorrhage
control (yes) and pulse stoppage were separate but asso
Table 1 Tourniquet Damage Results by Exposure
ciated measures of the phenomenon of limb hemorrhage
Exposure Group by Device Damage control.
Hemorrhage Control* Comparison of
Percentages All tourniquet devices except one were fully effective;
Group No Yes Total (p Value) the exception was a single SOFTTW device that failed
Heat exposure only in one test. This SOFTTW failed in its fifth test
Tourniquets, No. 30* after four prior successes; it was also successful in all its
Frequency 27 3 50 15 following tests. This SOFTTW failed by its inabil
(percentage of total) 45 5
Row percentage 90 10 ity to adequately tighten the strap: The strap material
1 bunched within the buckle, the strap was unable to slide
No heat exposure
Tourniquets, No. 30* through the buckle, and slack could not be removed
Frequency 27 3 50 from the strap.
(percentage of total) 45 5
Row percentage 90 10 The mean time to effectiveness was 4 seconds less in the
Total heatexposure group (p < .0001; Table 3). The mean
Tourniquets, No. 60* time to effectiveness was 2 seconds less for the more ex
Frequency 100 perienced user (p < .02).
(percentage of total) 54 6
Row percentage 90 10
Note: *The data refer to the number of tourniquets of any type used The difference in mean pressures between the noheat
in the experiment and that were examined for visible damage. Damage exposure group and the heatexposure group was
reported refers to a label that came off the device. 2mmHg; this difference was not statistically significant
Testing of Tourniquets Exposed to Prolonged Heat 35