
Page 22 - JSOM Fall 2024
P. 22
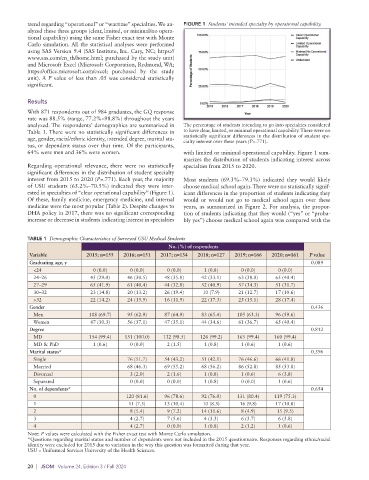
trend regarding “operational” or “wartime” specialties. We an-  FIGURE 1  Students’ intended specialty by operational capability.
          alyzed these three groups (clear, limited, or minimal/no opera-
          tional capability) using the same Fisher exact test with Monte
          Carlo simulation. All the statistical analyses were performed
          using SAS Version 9.4 (SAS Institute, Inc. Cary, NC; https://
          www.sas.com/en_th/home.html; purchased by the study unit)
          and Microsoft Excel (Microsoft Corporation, Redmond, WA;
          https://office.microsoft.com/excel; purchased by the study
          unit). A P value of less than .05 was considered statistically
          significant.

          Results
          With 871 respondents out of 984 graduates, the GQ response
          rate was 88.5% (range, 77.2%–98.8%) throughout the years
          analyzed. The respondents’ demographics are summarized in   The percentage of students intending to go into specialties considered
          Table 1. There were no statistically significant differences in   to have clear, limited, or minimal operational capability. There were no
          age, gender, racial/ethnic identity, intended degree, marital sta-  statistically significant differences in the distribution of student spe-
                                                             cialty interest over these years (P=.771).
          tus, or dependent status over that time. Of the participants,
          64% were men and 36% were women.                   with limited or minimal operational capability. Figure 1 sum-
                                                             marizes the distribution of students indicating interest across
          Regarding operational relevance, there were no statistically   specialties from 2015 to 2020.
          significant differences in the distribution of student specialty
          interest from 2015 to 2020 (P=.771). Each year, the majority   Most students (69.3%–79.3%) indicated they would likely
          of USU students (65.2%–70.5%) indicated they were inter-  choose medical school again. There were no statistically signif-
          ested in specialties of “clear operational capability” (Figure 1).   icant differences in the proportion of students indicating they
          Of these, family medicine, emergency medicine, and internal   would or would not go to medical school again over these
          medicine were the most popular (Table 2). Despite changes to   years, as summarized in Figure 2. For analysis, the propor-
          DHA policy in 2017, there was no significant corresponding   tion of students indicating that they would (“yes” or “proba-
          increase or decrease in students indicating interest in specialties   bly yes”) choose medical school again was compared with the


          TABLE 1  Demographic Characteristics of Surveyed USU Medical Students
                                                        No. (%) of respondents
           Variable          2015; n=155  2016; n=151  2017; n=134  2018; n=127  2019; n=166  2020; n=161  P value
           Graduating age, y                                                                           0.089
              <24              0 (0.0)      0 (0.0)     0 (0.0)     1 (0.8)     0 (0.0)     0 (0.0)
              24–26            45 (29.0)   46 (30.5)   48 (35.8)   42 (33.1)   63 (38.0)   65 (40.4)
              27–29            65 (41.9)   61 (40.4)   44 (32.8)   52 (40.9)   57 (34.3)   51 (31.7)
              30–32            23 (14.8)   20 (13.2)   26 (19.4)   10 (7.9)    21 (12.7)   17 (10.6)
              >32              22 (14.2)   24 (15.9)   16 (11.9)   22 (17.3)   25 (15.1)   28 (17.4)
           Gender                                                                                      0.436
              Men             108 (69.7)   95 (62.9)   87 (64.9)   83 (65.4)  105 (63.3)   96 (59.6)
              Women            47 (30.3)   56 (37.1)   47 (35.1)   44 (34.6)   61 (36.7)   65 (40.4)
           Degree                                                                                      0.812
              MD              154 (99.4)  151 (100.0)  132 (98.5)  126 (99.2)  165 (99.4)  160 (99.4)
              MD & PhD         1 (0.6)      0 (0.0)     2 (1.5)     1 (0.8)     1 (0.6)     1 (0.6)
           Marital status*                                                                             0.396
              Single                       76 (51.7)   54 (43.2)   51 (42.1)   76 (46.6)   66 (41.8)
              Married                      68 (46.3)   69 (55.2)   68 (56.2)   86 (52.8)   85 (53.8)
              Divorced                      3 (2.0)     2 (1.6)     1 (0.8)     1 (0.6)     6 (3.8)
              Separated                     0 (0.0)     0 (0.0)     1 (0.8)     0 (0.0)     1 (0.6)
           No. of dependents*                                                                          0.654
              0                           120 (81.6)   96 (78.6)   92 (76.0)  131 (80.4)   119 (75.3)
              1                            11 (7.5)    13 (10.4)   10 (8.3)    16 (9.8)    17 (10.8)
              2                             8 (5.4)     9 (7.2)    14 (11.6)    8 (4.9)    15 (9.5)
              3                             4 (2.7)     7 (5.6)     4 (3.3)     6 (3.7)     6 (3.8)
              4                             4 (2.7)     0 (0.0)     1 (0.8)     2 (1.2)     1 (0.6)
          Note: P values were calculated with the Fisher exact test with Monte Carlo simulation.
          *Questions regarding marital status and number of dependents were not included in the 2015 questionnaire. Responses regarding ethnic/racial
          identity were excluded for 2015 due to variation in the way this question was formatted during that year.
          USU = Uniformed Services University of the Health Sciences.

          20  |  JSOM   Volume 24, Edition 3 / Fall 2024