
Page 17 - JSOM Summer 2023
P. 17
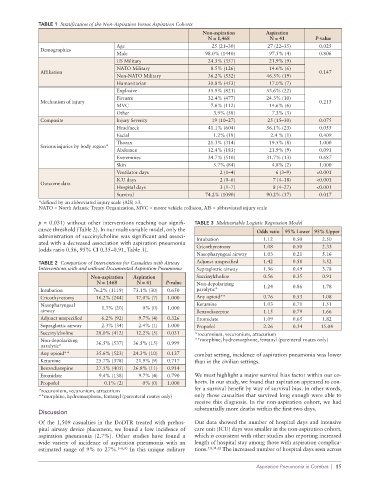
TABLE 1  Stratification of the Non-Aspiration Versus Aspiration Cohorts
                                                                   Non-aspiration       Aspiration
                                                                     N = 1,468           N = 41         P-value
                                       Age                            25 (21–30)        27 (22–35)       0.025
              Demographics
                                       Male                         98.0% (1440)         97.5% (4)       0.806
                                       US Military                   24.3% (357)         21.9% (9)
                                       NATO Military                  8.5% (126)         14.6% (6)
              Affiliation                                                                                0.147
                                       Non-NATO Military             36.2% (532)        46.3% (19)
                                       Humanitarian                  30.8% (453)         17.0% (7)
                                       Explosive                     55.9% (821)        53.6% (22)
                                       Firearm                       32.4% (477)        24.3% (10)
              Mechanism of injury                                                                        0.215
                                       MVC                            7.6% (112)         14.6% (6)
                                       Other                           3.9% (58)          7.3% (3)
              Composite                Injury Severity                19 (10–27)        25 (15–30)       0.075
                                       Head/neck                     41.1% (604)        56.1% (23)       0.055
                                       Facial                          1.2% (18)         2.4 % (1)       0.409
                                       Thorax                        21.3% (314)         19.5% (8)       1.000
              Serious injuries by body region*
                                       Abdomen                       12.4% (183)         21.9% (9)       0.091
                                       Extremities                   34.7% (510)        31.7% (13)       0.687
                                       Skin                            5.7% (84)          4.8% (2)       1.000
                                       Ventilator days                   2 (1–4)           6 (3–9)      <0.001
                                       ICU days                          2 (0–6)          7 (4–18)      <0.001
              Outcome data
                                       Hospital days                     3 (1–7)          8 (4–27)      <0.001
                                       Survival                     74.2% (1090)        90.2% (37)       0.017
              *defined by an abbreviated injury scale (AIS) ≥3.
              NATO = North Atlantic Treaty Organization, MVC = motor vehicle collision, AIS = abbreviated injury scale

              p = 0.031) without other interventions reaching our signifi-  TABLE 3  Multivariable Logistic Regression Model
              cance threshold (Table 2). In our multivariable model, only the        Odds ratio  95% Lower 95% Upper
              administration of succinylcholine was significant and associ-  Intubation  1.12    0.50     2.50
              ated with a decreased association with aspiration pneumonia
              (odds ratio 0.56, 95% CI 0.35–0.91, Table 3).      Cricothyrotomy        1.08      0.50     2.33
                                                                 Nasopharyngeal airway  1.03     0.21     5.16
              TABLE 2  Comparison of Interventions for Casualties with Airway   Adjunct unspecified  1.42  0.58  3.52
              Interventions with and without Documented Aspiration Pneumonia  Supraglottic airway  1.36  0.49  3.78
                               Non-aspiration  Aspiration        Succinylcholine       0.56      0.35     0.91
                                 N = 1468     N = 41   P-value   Non-depolarizing      1.24      0.86     1.78
              Intubation        76.2% (1119)  73.1% (30)  0.650  paralytic*
              Cricothyrotomy    16.2% (244)  17.0% (7)  1.000    Any opioid**          0.76      0.53     1.08
              Nasopharyngeal      1.3% (20)     0% (0)  1.000    Ketamine              1.03      0.71     1.51
              airway                                             Benzodiazepine        1.15      0.79     1.66
              Adjunct unspecified  6.2% (92)  9.7% (4)  0.326    Etomidate             1.09      0.65     1.82
              Supraglottic airway  2.3% (34)  2.4% (1)  1.000    Propofol              2.26      0.34     15.04
              Succinylcholine   28.0% (412)  12.2% (5)  0.031    *rocuronium, vecuronium, atracurium
              Non-depolarizing                                   **morphine, hydromorphone, fentanyl (parenteral routes only)
              paralytic*        36.5% (537)  36.5% (15)  0.999
              Any opioid**      35.6% (523)  24.3% (10)  0.137   combat setting, incidence of aspiration pneumonia was lower
              Ketamine          25.7% (378)  21.9% (9)  0.717    than in the civilian settings.
              Benzodiazepine    27.5% (405)  26.8% (11)  0.914
              Etomidate          9.4% (138)   9.7% (4)  0.790    We must highlight a major survival bias factor within our co-
              Propofol             0.1% (2)     0% (0)  1.000    horts. In our study, we found that aspiration appeared to con-
              *rocuronium, vecuronium, atracurium                fer a survival benefit by way of survival bias. In other words,
              **morphine, hydromorphone, fentanyl (parenteral routes only)  only those casualties that survived long enough were able to
                                                                 receive this diagnosis. In the non-aspiration cohort, we had
                                                                 substantially more deaths within the first two days.
              Discussion
              Of the 1,509 casualties in the DoDTR treated with prehos-  Our data showed the number of hospital days and intensive
              pital airway device placement, we found a low incidence of   care unit (ICU) days was smaller in the non-aspiration cohort,
              aspiration  pneumonia  (2.7%). Other  studies  have  found a   which is consistent with other studies also reporting increased
              wide variety of incidence of aspiration pneumonia with an   length of hospital stay among those with aspiration complica-
              estimated range of 9% to 27%. 5–8,30  In this unique military   tions. 5,8,31,32  The increased number of hospital days seen across

                                                                                     Aspiration Pneumonia in Combat  |  15