
Page 42 - JSOM Spring 2023
P. 42
CQT students with at least one lower leg injury (20/187 = TABLE 2 Cause of Musculoskeletal Injuries Among 142 SWCC
10.7%) was significantly higher than the percentage of SWCC Operators and 187 CQT Students During a One-Year Period
Operators with at least one lower leg injury (2/142 = 1.4%; [Count (Percent)]
p < 0.001). The percentage of CQT students with at least one Cause of Injury SWCC Operators CQT Students
knee injury (14/187 = 7.5%) was not significantly different Climbing 0 (0.0) 2 (2.0)
than the percentage of SWCC Operators with at least one knee Compression from Boating 0 (0.0) 1 (1.0)
injury (9/142 = 6.3%; p = 0.828). Crushing 0 (0.0) 2 (2.0)
Direct Trauma 5 (13.2) 5 (5.1)
TABLE 1 Anatomic Sub-Location of Musculoskeletal Injuries
Among 142 SWCC Operators and 187 CQT Students During a Fall 3 (7.9) 4 (4.1)
One-Year Period [Count (Percent)] Jump 1 (2.6) 0 (0.0)
Anatomic Anatomic Landing 2 (5.3) 0 (0.0)
Location Sub-Location SWCC Operators CQT Students Lifting 9 (23.7) 8 (8.2)
Lower Hip 0 (0.0) 3 (3.1) Marching 1 (2.6) 0 (0.0)
Extremity Knee 11 (28.9) 15 (15.3) Planting 2 (5.3) 1 (1.0)
Ankle 3 (7.9) 11 (11.2) Pulling 1 (2.6) 2 (2.0)
Thigh 3 (7.9) 9 (9.2) Running 6 (15.8) 54 (55.1)
Lower leg 2 (5.3) 20 (20.4) Twist/Turn/Slip (no fall) 2 (5.3) 1 (1.0)
Foot and toes 0 (0.0) 7 (7.1) Whiplash 0 (0.0) 2 (2.0)
Upper Shoulder 8 (21.1) 16 (16.3) Other 3 (7.9) 13 (13.3)
Extremity Wrist 0 (0.0) 2 (2.0) Unknown 3 (7.9) 3 (3.1)
Upper arm 1 (2.6) 1 (1.0) Total 38 98
Hand and fingers 2 (5.3) 5 (5.1) SWCC = Special Warfare Combatant-Craft Crewman, CQT = Crew-
Spine Cervical 0 (0.0) 2 (2.0) man Qualification Training
Lumbopelvic 5 (13.2) 7 (7.1)
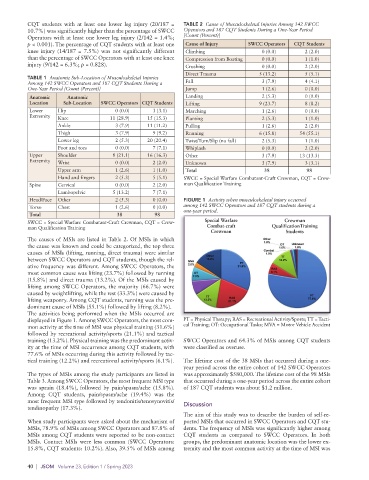
Head/Face Other 2 (5.3) 0 (0.0) FIGURE 1 Activity when musculoskeletal injury occurred
Torso Chest 1 (2.6) 0 (0.0) among 142 SWCC Operators and 187 CQT students during a
one-year period.
Total 38 98
SWCC = Special Warfare Combatant-Craft Crewman, CQT = Crew- Special Warfare Crewman
man Qualification Training Combat-craft QualificationTraining
Crewman Students
The causes of MSIs are listed in Table 2. Of MSIs in which
the cause was known and could be categorized, the top three
causes of MSIs (lifting, running, direct trauma) were similar
between SWCC Operators and CQT students, though the rel-
ative frequency was different. Among SWCC Operators, the
most common cause was lifting (23.7%) followed by running
(15.8%) and direct trauma (13.2%). Of the MSIs caused by
lifting among SWCC Operators, the majority (66.7%) were Combat
7.9%
caused by weightlifting, while the rest (33.3%) were caused by
lifting weaponry. Among CQT students, running was the pre-
dominant cause of MSIs (55.1%) followed by lifting (8.2%).
The activities being performed when the MSIs occurred are
displayed in Figure 1. Among SWCC Operators, the most com- PT = Physical Therapy; RAS = Recreational Activity/Sports; TT = Tacti-
mon activity at the time of MSI was physical training (31.6%) cal Training; OT: Occupational Tasks; MVA = Motor Vehicle Accident
followed by recreational activity/sports (21.1%) and tactical
training (13.2%). Physical training was the predominant activ- SWCC Operators and 64.3% of MSIs among CQT students
ity at the time of MSI occurrence among CQT students, with were classified as overuse.
77.6% of MSIs occurring during this activity followed by tac-
tical training (12.2%) and recreational activity/sports (6.1%). The lifetime cost of the 38 MSIs that occurred during a one-
year period across the entire cohort of 142 SWCC Operators
The types of MSIs among the study participants are listed in was approximately $580,000. The lifetime cost of the 98 MSIs
Table 3. Among SWCC Operators, the most frequent MSI type that occurred during a one-year period across the entire cohort
was sprain (18.4%), followed by pain/spasm/ache (15.8%). of 187 CQT students was about $1.2 million.
Among CQT students, pain/spasm/ache (19.4%) was the
most frequent MSI type followed by tendonitis/tenosynovitis/ Discussion
tendinopathy (17.3%).
The aim of this study was to describe the burden of self-re-
When study participants were asked about the mechanism of ported MSIs that occurred in SWCC Operators and CQT stu-
MSIs, 78.9% of MSIs among SWCC Operators and 87.8% of dents. The frequency of MSIs was significantly higher among
MSIs among CQT students were reported to be non-contact CQT students as compared to SWCC Operators. In both
MSIs. Contact MSIs were less common (SWCC Operators: groups, the predominant anatomic location was the lower ex-
15.8%, CQT students: 10.2%). Also, 39.5% of MSIs among tremity and the most common activity at the time of MSI was
40 | JSOM Volume 23, Edition 1 / Spring 2023