
Page 45 - JSOM Winter 2022
P. 45
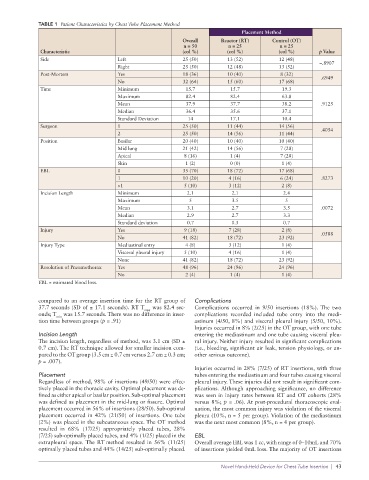
TABLE 1  Patient Characteristics by Chest Tube Placement Method
                                                                                Placement Method
                                                             Overall     Reactor (RT)     Control (OT)
                                                             n = 50         n = 25          n = 25
              Characteristic                                 (col %)       (col %)          (col %)      p Value
              Side                     Left                  25 (50)       13 (52)          12 (48)
                                                                                                         –.8907
                                       Right                 25 (50)       12 (48)          13 (52)
              Post-Mortem              Yes                   18 (36)       10 (40)           8 (32)       .6949
                                       No                    32 (64)       15 (60)          17 (68)
              Time                     Minimum                15.7          15.7             19.3
                                       Maximum                82.4          82.4             63.8
                                       Mean                   37.9          37.7             38.2         .9125
                                       Median                 36.4          35.6             37.1
                                       Standard Deviation     14            17.1             10.4
              Surgeon                  1                     25 (50)       11 (44)          14 (56)
                                                                                                          .4054
                                       2                     25 (50)       14 (56)          11 (44)
              Position                 Basilar               20 (40)       10 (40)          10 (40)
                                       Mid lung              21 (42)       14 (56)           7 (28)
                                       Apical                8 (16)         1 (4)            7 (28)
                                       Skin                   1 (2)         0 (0)            1 (4)
              EBL                      0                     35 (70)       18 (72)          17 (68)
                                       1                     10 (20)        4 (16)           6 (24)       .8273
                                       >1                    5 (10)         3 (12)           2 (8)
              Incision Length          Minimum                2.1            2.1              2.4
                                       Maximum                 5             3.5              5
                                       Mean                   3.1            2.7              3.5         .0072
                                       Median                 2.9            2.7              3.3
                                       Standard deviation     0.7            0.3              0.7
              Injury                   Yes                   9 (18)         7 (28)           2 (8)        .0588
                                       No                    41 (82)       18 (72)          23 (92)
              Injury Type              Mediastinal entry      4 (8)         3 (12)           1 (4)
                                       Visceral pleural injury  5 (10)      4 (16)           1 (4)
                                       None                  41 (82)       18 (72)          23 (92)
              Resolution of Pneumothorax  Yes                48 (96)       24 (96)          24 (96)
                                       No                     2 (4)         1 (4)            1 (4)
              EBL = estimated blood loss.


              compared to an average insertion time for the RT group of   Complications
              37.7 seconds (SD of ± 17.1 seconds). RT T max  was 82.4 sec-  Complications occurred in 9/50 insertions (18%).  The two
              onds; T  was 15.7 seconds. There was no difference in inser-  complications recorded included tube entry into the medi-
                   min
              tion time between groups (p = .91)                 astinum (4/50, 8%) and visceral pleural injury (5/50, 10%).
                                                                 Injuries occurred in 8% (2/25) in the OT group, with one tube
              Incision Length                                    entering the mediastinum and one tube causing visceral pleu-
              The incision length, regardless of method, was 3.1 cm (SD ±    ral injury. Neither injury resulted in significant complications
              0.7 cm). The RT technique allowed for smaller incision com-  (i.e., bleeding, significant air leak, tension physiology, or an-
              pared to the OT group (3.5 cm ± 0.7 cm versus 2.7 cm ± 0.3 cm;    other serious outcome).
              p = .007).
                                                                 Injuries occurred in 28% (7/25) of RT insertions, with three
              Placement                                          tubes entering the mediastinum and four tubes causing visceral
              Regardless of method, 98% of insertions (49/50) were effec-  pleural injury. These injuries did not result in significant com-
              tively placed in the thoracic cavity. Optimal placement was de-  plications. Although approaching significance, no difference
              fined as either apical or basilar position. Sub-optimal placement   was seen in injury rates between RT and OT cohorts (28%
              was defined as placement in the mid-lung or fissure. Optimal   versus 8%; p = .06). At post-procedural thoracoscopic eval-
              placement occurred in 56% of insertions (28/50). Sub-optimal   uation, the most common injury was violation of the visceral
              placement occurred in 42% (21/50) of insertions. One tube   pleura (10%, n = 5 per group). Violation of the mediastinum
              (2%) was placed in the subcutaneous space. The OT method   was the next most common (8%, n = 4 per group).
              resulted  in 68% (17/25)  appropriately  placed tubes,  28%
              (7/25) sub-optimally placed tubes, and 4% (1/25) placed in the   EBL
              extrapleural space. The RT method resulted in 56% (11/25)   Overall average EBL was 1 cc, with range of 0–10mL and 70%

              optimally placed tubes and 44% (14/25) sub-optimally placed.  of insertions yielded 0mL loss. The majority of OT insertions
                                                                         Novel Hand-Held Device for Chest Tube Insertion  |  43