
Page 60 - 2022 Spring JSOM
P. 60
3. Attach IO needle to the EZ-IO Power Driver. comparisons, each confirmed with nonparametric statistics.
4. Insert IO needle. Effect sizes are expressed as the differences between means in
5. Remove stylet. units of standard deviation (Cohen’s d). 21,22 Effect sizes are cat-
6. Secure EZ-Connect Extension Set to the IO tubing. egorized as small (d <0.20), medium (d = 0.20 to 0.80), and
large (d ≥ .80). 21
The experiment did not begin until participants indicated that
they were comfortable with these steps. Success data were analyzed using Cochran’s Q and localizing
McNemar’s tests. Differences were considered to be statisti-
Data Collection cally significant at the p < .05 threshold. All analyses were
All participants were required to wear nitrile gloves during conducted in SPSS software (version 23; IBM).
the procedures and were not allowed to open any packaging
before the start time. However, participants could arrange the
materials on an adjacent table as they preferred. One proctor Results
was present at each procedural station. Each round of testing Procedure Success
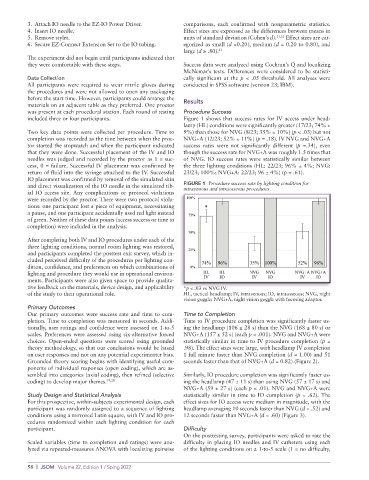
included three or four participants. Figure 1 shows that success rates for IV access under head-
lamp (HL) conditions were significantly greater (17/23; 74% ±
Two key data points were collected per procedure. Time to 9%) than those for NVG (8/23; 35% ± 10%) (p < .03) but not
completion was recorded as the time between when the proc- NVG+A (12/23; 52% ± 11%) (p = .18). IV NVG and NVG+A
tor started the stopwatch and when the participant indicated success rates were not significantly different (p =.34), even
that they were done. Successful placement of the IV and IO though the success rate for NVG+A was roughly 1.5 times that
needles was judged and recorded by the proctor as 1 = suc- of NVG. IO success rates were statistically similar between
cess, 0 = failure. Successful IV placement was confirmed by the three lighting conditions (HL: 22/23; 96% ± 4%; NVG:
return of fluid into the syringe attached to the IV. Successful 23/23; 100%; NVG+A: 22/23; 96 ± 4%) (p = .61).
IO placement was confirmed by removal of the simulated skin
and direct visualization of the IO needle in the simulated tib- FIGURE 1 Procedure success rate by lighting condition for
intravenous and intraosseous procedures.
ial IO access site. Any complications or protocol violations
were recorded by the proctor. There were two protocol viola-
tions: one participant lost a piece of equipment, necessitating
a pause, and one participant accidentally used red light instead
of green. Neither of these data points (access success or time to
completion) were included in the analysis.
After completing both IV and IO procedures under each of the
three lighting conditions, normal room lighting was restored,
and participants completed the posttest exit survey, which in-
cluded perceived difficulty of the procedures per lighting con-
dition, confidence, and preferences on which combinations of
lighting and procedure they would use in operational environ-
ments. Participants were also given space to provide qualita-
tive feedback on the materials, device design, and applicability *p < .03 vs NVG IV.
of the study to their operational role. HL, tactical headlamp; IV, intravenous; IO, intraosseous; NVG, night
vision goggle; NVG+A, night vision goggle with focusing adaptor.
Primary Outcomes
Our primary outcomes were success rate and time to com- Time to Completion
pletion. Time to completion was measured in seconds. Addi- Time to IV procedure completion was significantly faster us-
tionally, user ratings and confidence were assessed on 1-to-5 ing the headlamp (106 ± 28 s) than the NVG (168 ± 80 s) or
scales. Preferences were assessed using six-alternative forced NVG+A (157 ± 52 s) (each p < .001). NVG and NVG+A were
choices. Open-ended questions were scored using grounded statistically similar in time to IV procedure completion (p =
theory methodology, so that our conclusions would be based .98). The effect sizes were large, with headlamp IV completion
on user responses and not on any potential experimenter bias. 1 full minute faster than NVG completion (d = 1.00) and 51
Grounded theory scoring begins with identifying useful com- seconds faster than that of NVG+A (d = 0.82) (Figure 2).
ponents of individual responses (open coding), which are as-
sembled into categories (axial coding), then refined (selective Similarly, IO procedure completion was significantly faster us-
coding) to develop major themes. 19,20 ing the headlamp (47 ± 11 s) than using NVG (57 ± 17 s) and
NVG+A (59 ± 27 s) (each p < .01). NVG and NVG+A were
Study Design and Statistical Analysis statistically similar in time to IO completion (p = .62). The
For this prospective, within-subjects experimental design, each effect sizes for IO access were medium in magnitude, with the
participant was randomly assigned to a sequence of lighting headlamp averaging 10 seconds faster than NVG (d = .52) and
conditions using a mirrored Latin square, with IV and IO pro- 12 seconds faster than NVG+A (d = .60) (Figure 3).
cedures randomized within each lighting condition for each
participant. Difficulty
On the posttesting survey, participants were asked to rate the
Scaled variables (time to completion and ratings) were ana- difficulty in placing IO needles and IV catheters using each
lyzed via repeated-measures ANOVA with localizing pairwise of the lighting conditions on a 1-to-5 scale (1 = no difficulty,
58 | JSOM Volume 22, Edition 1 / Sping 2022