
Page 110 - JSOM Fall 2021
P. 110
in < 23 min. Runners were excluded if they had had an injury FIGURE 2 Energy cost at two different run speeds in conventional
in the previous 3 months, undergone surgery in the past year, running shoes (CRS) and minimalist running shoes (MRS) during
or had used orthotics. Selected participants gradually adapted 26-week study.
to either CRS or a MRS over 20 weeks. The CRS group (n
= 30) transitioned from their usual running shoe to an Asics
Gel Cumulus (ASICS) (weight = 0.73 ± 0.06 lb, heel height =
1.3 in, heel drop = 0.4 in). The MRS group (n = 31) gradually
transitioned from their usual running shoes to an Asics Pira-
nha SP4 (weight = 0.30 ± 0.02 lb, heel height = 0.9 in, heel
drop = 0.2 in, cushioned MRS). Figure 1 shows the shoes used
by both groups. Both groups increased the amount of training
time spent in their respective assigned shoes by 5% each week.
Thus, at week 6, both groups ran 35% of their training time in
the assigned shoes (65% of the time in regular training shoes)
and by week 20, they were running 100% of their training time
in the assigned shoes. From weeks 20 through 26, they contin-
ued training in their respective study shoes 100% of the time. ES, effect size; NS, not statistically significant; W, week (e.g., W6 =
week 6).
FIGURE 1 The conventional and minimalist shoes used in the instructed to complete the distance as fast as possible. Figure 3
investigations.
shows the results for the 5-km time trial. At week 0 (baseline
measures), when both groups ran in their assigned shoes for
the first time, there were no significant differences between the
CRS and MRS groups. At week 6, both groups improved their
5-km running time, but the improvement was greater for par-
ticipants in the MRS (1.9% vs 3.8%; p < .05). After 26 weeks
of training, there were no further improvements in 5-km run
times for either group. 9,10
FIGURE 3 Five-kilometer time trial performance in conventional
running shoes (CRS) and minimalist running shoes (MRS) during
26-week study.
Investigators not only examined the statistical significance of
any changes or differences between groups but also looked at
the effect sizes (ES). Effect size is calculated by taking into ac-
count the difference in mean changes and the variance (stan-
dard deviation) of these changes (i.e., mean -mean /pooled
2
1
standard deviation). ES <0.20 were considered trivial; 0.20 to
0.49, small; 0.50 to 0.79, moderate; and ≥0.80, large. 12
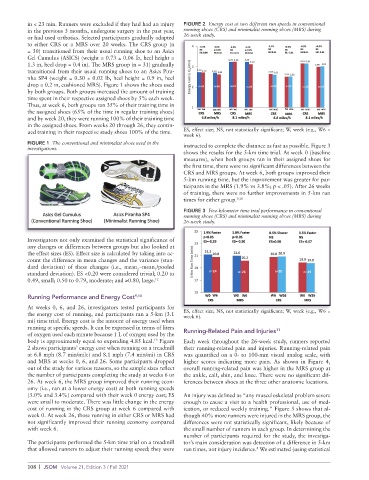
Running Performance and Energy Cost 9,10
At weeks 0, 6, and 26, investigators tested participants for
the energy cost of running, and participants ran a 5-km (3.1 ES, effect size; NS, not statistically significant; W, week (e.g., W6 =
week 6).
mi) time trial. Energy cost is the amount of energy used when
running at specific speeds. It can be expressed in terms of liters 11
of oxygen used each minute because 1 L of oxygen used by the Running-Related Pain and Injuries
13
body is approximately equal to expending 4.85 kcal. Figure Each week throughout the 26-week study, runners reported
2 shows participants’ energy cost when running on a treadmill their running-related pain and injuries. Running-related pain
at 6.8 mph (8.7 min/mile) and 8.1 mph (7.4 min/mi) in CRS was quantified on a 0- to 100-mm visual analog scale, with
and MRS at weeks 0, 6, and 26. Some participants dropped higher scores indicating more pain. As shown in Figure 4,
out of the study for various reasons, so the sample sizes reflect overall running-related pain was higher in the MRS group at
the number of participants completing the study at weeks 6 or the ankle, calf, shin, and knee. There were no significant dif-
26. At week 6, the MRS group improved their running econ- ferences between shoes at the three other anatomic locations.
omy (i.e., ran at a lower energy cost) at both running speeds
(3.0% and 3.4%) compared with their week 0 energy cost; ES An injury was defined as “any musculoskeletal problem severe
were small to moderate. There was little change in the energy enough to cause a visit to a health professional, use of med-
cost of running in the CRS group at week 6 compared with ication, or reduced weekly training.” Figure 5 shows that al-
week 0. At week 26, those running in either CRS or MRS had though 40% more runners were injured in the MRS group, the
not significantly improved their running economy compared differences were not statistically significant, likely because of
with week 6. the small number of runners in each group. In determining the
number of participants required for the study, the investiga-
The participants performed the 5-km time trial on a treadmill tor’s main consideration was detection of a difference in 5-km
that allowed runners to adjust their running speed; they were run times, not injury incidence. We estimated (using statistical
8
108 | JSOM Volume 21, Edition 3 / Fall 2021