
Page 57 - 2020 JSOM Winter
P. 57
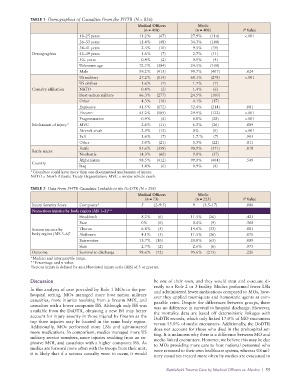
TABLE 1  Demographics of Casualties From the PHTR (N = 826)
                                                          Medical Officers         Medic
                                                             (n = 418)            (n = 408)          P Value
                                  18–25 years              11.2%    (47)         27.9%   (114)        <.001
                                  26–33 years              11.4%   (48)          34.3%   (140)
                                  34–41 years              2.3%    (10)          9.5%   (39)
              Demographics        42–49 years              1.6%    (7)           2.7%   (11)
                                  50+ years                0.4%    (2)           0.9%    (4)
                                  Unknown age              72.7%   (304)         24.5%   (100)
                                  Male                     99.2%   (415)         99.7%    (407)        .624
                                  US military              27.2%   (114)         68.1%    (278)       <.001
                                  US civilian               1.6%    (7)           1.7%    (7)
              Casualty affiliation  NATO                    0.4%    (2)           1.4%    (6)
                                  Host-nation military     66.3%   (277)         24.5%    (100)
                                  Other                     4.3%    (18)          4.1%    (17)
                                  Explosive                41.5%   (172)         52.4%    (214)        .001
                                  Firearm                  45.2%   (189)         29.9%    (122)       <.001
                                  Fragmentation             0.9%    (4)           6.8%    (28)        <.001
              Mechanism of injury*  MVC                     2.6%    (11)          6.3%    (26)         .009
                                  Aircraft crash            2.9%    (12)          0%     (0)          <.001
                                  Fall                      1.6%    (7)           1.7.%    (7)         .963
                                  Other                     5.0%    (21)          5.3%    (22)         .811
                                  Battle                   85.6%   (358)         90.9%    (371)        .018
              Battle status
                                  Nonbattle                14.3%    (60)          9.0%    (37)
                                  Afghanistan              98.5%   (412)         99.0%    (404)        .549
              Country
                                  Iraq                      1.4%    (6)           0.9%    (4)
              *Casualties could have more than one documented mechanism of injury.
              NATO = North Atlantic Treaty Organization; MVC = motor vehicle crash.

              TABLE 2  Data From PHTR Casualties Linkable to the DoDTR (N = 298)
                                                          Medical Officers         Medic
                                                             (n = 73)             (n = 225)          P Value
              Injury Severity Score  Composite*            5     (2–9.5)         9   (3.5–17)          .006
              Nonserious injuries by body region (AIS 1–2)**
                                  Head/neck                 8.2%    (6)          11.5%   (26)          .423
                                  Face                      0%    (0)             0.4%    (9)          .568
              Serious injuries by    Thorax                 6.8%    (5)          14.6%    (33)         .081
              body region (AIS 3–6) †  Abdomen              4.1%    (3)          11.5%    (26)         .070
                                  Extremities              13.7%   (10)          28.8%    (65)         .009
                                  Skin                      2.7%    (2)           2.6%    (6)          .973
              Outcome             Survival to discharge    98.6%   (72)          95.6%   (215)         .226
              *Median and interquartile range.
              **Percentage and n value.
              † Serious injury is defined by an abbreviated injury scale (AIS) of 3 or greater.


              Discussion                                         be one of their own, and they would treat and evacuate di-
                                                                 rectly to a Role 2 or 3 facility. Medics performed fewer LSIs
              In this analysis of care provided by Role 1 MOs in the pre-  and administered fewer medications compared to MOs, how-
              hospital setting, MOs managed more host nation military   ever they applied tourniquets and hemostatic agents at com-
              casualties, more injuries resulting from a firearm MOI, and   parable rates. Despite the differences between groups, there
              casualties with a lower composite ISS. Although only ISS was   was no difference in survival to hospital discharge. However,
              available from the DoDTR, obtaining a new ISS may better   the mortality data are based off deterministic linkages with
              account for injury severity in those injured by firearm as the   DoDTR records, which only linked 17.0% of MO encounters
              top three injuries may be located in the same body region.   versus 55.0% of medic encounters. Additionally, the DoDTR
              Additionally, MOs performed more LSIs and administered   does not account for those who died in the prehospital set-
              more medications. In comparison, medics managed more US   ting. It is unknown why there is a difference between MO and
              military service members, more injuries resulting from an ex-    medic-linked encounters. However, we believe this may be due
              plosive MOI, and casualties with a higher composite ISS. As   to MOs providing more care to host national personnel who
              medics are forward more often with the troops from their unit,   were returned to their own healthcare system, whereas US mil-
              it is likely that if a serious casualty were to occur, it would
                                                                 itary casualties treated more often by medics are evacuated to

                                                                      Battlefield Trauma Care by Medical Officers vs. Medics  |  55