
Page 164 - JSOM Fall 2020
P. 164
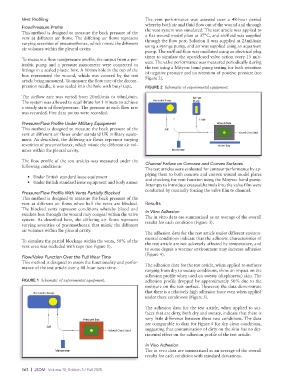
Vent Profiling                                     The vent performance was assessed over a 48-hour period
                                                             whereby both air and fluid flow out of the wound and through
          Flow/Pressure Profile                              the vent system was simulated. The test article was applied to
          This method is designed to measure the back pressure of the   a flat wound model plate at 37°C, and air/fluid was supplied
          vent at different air flows. The differing air flows represent   through the flow port. Solution A was supplied at 25mL/min
          varying severities of pneumothorax, which mimic the different   using a syringe pump, and air was supplied using an aquarium
          air volumes within the pleural cavity.
                                                             pump. The air/fluid flow was oscillated using an electrical plug
                                                             timer to simulate the open/closed valve action every 15 min-
          To measure a flow rate/pressure profile, the output from a per-  utes. The valve performance was measured periodically during
          istaltic pump and a pressure manometer were connected to   the test using a Mityvac hand pump testing for both retention
          fittings in a sealed plastic box. A 10mm hole in the top of the   of negative pressure and no retention of positive pressure (see
          box represented the wound, which was covered by the test   Figure 2).
          article being measured. To measure the flow rate of the decom-
          pression needle, it was sealed into the hole with butyl tape.  FIGURE 2  Schematic of experimental equipment.
          The airflow rate was varied from 20mL/min to 60mL/min.
          The system was allowed to equilibrate for 1 minute to achieve
          a steady state of flow/pressure. The pressure at each flow rate
          was recorded. Five data points were recorded.

          Pressure/Flow Profile Under Military Equipment
          This method is designed to measure the back pressure of the
          vent at different air flows under standard UK military equip-
          ment. As described, the differing air flows represent varying
          severities of pneumothorax, which mimic the different air vol-
          umes within the pleural cavity.

          The flow profile of the test articles was measured under the
          following conditions:                              Channel Failure on Concave and Convex Surfaces
                                                             The test articles were evaluated for contour performance by ap-
                                                             plying them to both concave and convex wound model plates
            •  Under British standard issue equipment        and checking for vent function using the Mityvac hand pump.
            •  Under British standard issue equipment and body armor
                                                             Attempts to introduce creases/channels into the valve film were
                                                             conducted by manually forcing the valve film to channel.
          Pressure/Flow Profile With Vents Partially Blocked
          This method is designed to measure the back pressure of the
          vent at different air flows when half the vents are blocked.   Results
          The blocked vents represent conditions whereby blood and
          exudate loss through the wound may congeal within the valve   In Vitro Adhesion
                                                             The in vitro data are summarized as an average of the overall
          system.  As  described  here,  the  differing  air  flows  represent   results for each condition (Figure 3).
          varying severities of pneumothorax that mimic the different
          air volumes within the pleural cavity.
                                                             The adhesion data for the test article under different environ-
                                                             mental conditions indicate that the adhesive characteristics of
          To simulate the partial blockage within the vents, 50% of the   the test article are not adversely affected by temperature, and
          vent area was occluded with tape (see Figure 1).
                                                             to some degree a warmer environment may increase adhesion
                                                             (Figure 4).
          Flow/Valve Function Over the Full Wear Time
          This method is designed to assess the functionality and perfor-  The adhesion data for the test article, when applied to surfaces
          mance of the test article over a 48-hour wear time.
                                                             ranging from dry to sweaty conditions, show an impact on the
                                                             adhesion profile when used on sweaty (diaphoretic) skin. The
          FIGURE 1  Schematic of experimental equipment.     adhesion profile dropped by approximately 50% due to the
                                                             moisture on the test surface. However, the data demonstrate
                                                             that there is a relatively high adhesion force even when applied
                                                             under these conditions (Figure 5).
                                                             The adhesion data for the test article, when applied to sur-
                                                             faces that are dirty, both dry and sweaty, indicate that there is
                                                             very little difference between these two conditions. The data
                                                             are comparable to data for Figure 4 for dry clean conditions,
                                                             suggesting that contamination of dirty on the skin has no det-
                                                             rimental effect on the adhesion profile of the test article.

                                                             In Vivo Adhesion
                                                             The in vivo data are summarized as an average of the overall
                                                             results for each condition with standard deviations.


          162  |  JSOM   Volume 20, Edition 3 / Fall 2020