
Page 75 - Journal of Special Operations Medicine - Summer 2015
P. 75
exercise, the soldiers had to complete and pass an ergo- The participants were divided into two groups, Finish-
metry stress test (with a minimum of 3W/kg of body ers and Nonfinishers, and the data were tested for nor-
weight), the Bundeswehr Standard Sport Tests, a psycho- mal distribution using the Shapiro-Wilk test. For the
logical assessment, and a 10-week special training pro- data that were normally distributed, a t-test was con-
gram. During the exercise, the soldiers had to cover a ducted to compare the groups. For the data that were
distance of approximately 160km over hilly terrain while not normally distributed, comparison was made using
carrying equipment weighing approximately 30kg. Indi- the Mann-Whitney U test (SPSS Statistics version 20
viduals moved as a member of a small team, with each software; IBM Deutschland GmbH; www.ibm.com/de
team having to carry a crate of additional equipment /de). In each case, the significance level was set at p ≤
weighing approximately 25kg. The exercise was designed .05. In addition, a purely descriptive comparison with
as an orientation march, and the teams were tasked to published data from extreme endurance exercises dur-
find their own routes between checkpoints. For safety ing civilian events was carried out.
reasons, each team was accompanied by an instructor.
The march was frequently interrupted so that special Results
tasks could be performed. These tasks, lasting about 30
minutes, were executed at a maximum level of physical Of the 51 participants, 22 completed the exercise
exertion. Breaks of about 6 hours were taken in the af- (43.1% Finishers). The blood levels of 46 soldiers were
ternoon and, during this time, the soldiers had to set up analyzed (90.2%). The serum collection tube of one sol-
camp before they could sleep. In addition to the physical dier did not contain enough blood for analysis and four
exertion, the soldiers had to make do with a reduced food other soldiers refused to have their blood taken. The
supply and with drinking just water, but were allowed to Nonfinishers endured physical exertion for an average
drink as much as they wanted. In summary, the test was a of 2.5 days, the Finishers for an average of 5 days.
5-day endurance test involving marching with additional
carried weights, sleep deprivation, a reduced food supply, Hyponatremia
and short periods of maximum exertion. Mild hyponatremia was defined as a sodium level of
135mmol/L or lower. Hyponatremia was considered
Before starting the exercise, all participants’ body severe for sodium levels of 130mmol/L or lower and
weights were measured and the participants were exam- critical for sodium levels of 120mmol/L or lower. Three
8
ined by a physician to identify any medical conditions soldiers (5.9%) were diagnosed with mild hyponatre-
disqualifying their participation. During the course of mia (two Finishers (134mmol/L and 135mmol/L) and
the exercise, the Nonfinishers had their blood and tem- one Nonfinisher (133.2mmol/L). No cases of severe or
perature taken (tympanic measurement using a Braun even critical hyponatremia were detected. There was no
ThermoScan ; Braun GmbH; www.brauntherms.com) significant difference in the sodium concentration be-
®
in a warm environment immediately after dropping tween the Finishers (mean ± standard deviation [SD]:
out, while the Finishers had their blood and tempera- 138.3mmol/L ± 2.1mmol/L) and the Nonfinishers (mean
ture taken at the finish. Within 4 hours, the blood was ± SD: 139.4mmol/L ± 2.1mmol/L).
delivered to the laboratory of a local civilian hospital
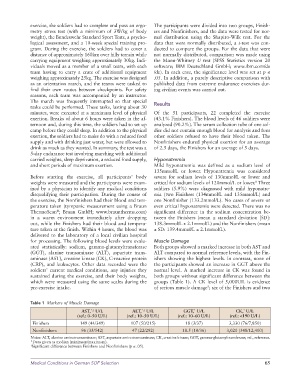
for processing. The following blood levels were evalu- Muscle Damage
ated statistically: sodium, gamma-glutamyltransferase Both groups showed a marked increase in both AST and
(GGT), alanine transaminase (ALT), aspartate trans- ALT compared to normal reference levels, with the Fin-
aminase (AST), creatine kinase (CK), C-reactive protein ishers showing the highest levels. In contrast, none of
(CRP), and leukocytes. Other data recorded were the the participants showed an increase in GGT above the
soldiers’ current medical conditions, any injuries they normal level. A marked increase in CK was found in
sustained during the exercise, and their body weights, both groups without significant difference between the
which were measured using the same scales during the groups (Table 1). A CK level of 5,000U/L is evidence
pre-exercise intake. of serious muscle damage ; six of the Finishers and two
9
Table 1 Markers of Muscle Damage
AST, U/L ALT, U/L GGT, U/L CK, U/L
*,†
*
*
*,†
(ref.: 0–50 U/L) (ref.: 10–50 U/L) (ref.: 10–60 U/L) (ref.: <190 U/L)
Finishers 149 (44/349) 107 (50/215) 18 (3/37) 3,330 (76/7,850)
Nonfinishers 96 (33/542) 47 (22/292) 18.5 (10/36) 3,020 (348/12,400)
Notes: ALT, alanine aminotransaminase; AST, aspartate aminotransaminase; CK, creatine kinase; GGT, gamma-glutamyltransferase; ref., reference.
*Data given as median (minimum/maximum).
† Significant difference between Finishers and Nonfinishers (p ≤ .05).
Medical Conditions in German SOF Selection 65