
Page 54 - Journal of Special Operations Medicine - Summer 2015
P. 54
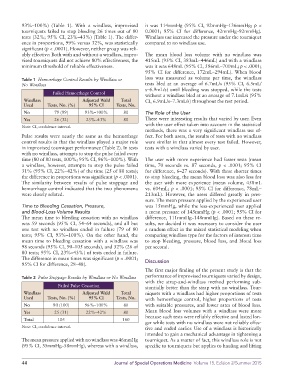
93%–100%) (Table 1). With a windlass, improvised   it was 114mmHg (95% CI, 92mmHg–136mmHg; p <
          tourniquets failed to stop bleeding 26 times out of 80   0.0001; 95% CI for difference, 42mmHg–92mmHg).
          tests (32%; 95% CI, 23%–43%) (Table 1). The differ-  Windlass use increased the pressure under the tourniquet
          ence in proportions, 99% versus 32%, was statistically   compared to no windlass use.
          significant (p < .0001). However, neither group was reli-
          ably effective: Both with and without a windlass, impro-  The mean blood loss volume with no windlass was
          vised tourniquets did not achieve 80% effectiveness, the   415mL (95% CI, 383mL–446mL) and with a windlass
          minimum threshold of reliable effectiveness.       was it was 648mL (95% CI, 596mL–700mL; p < .0001;
                                                             95% CI for difference, 172mL–294mL). When blood
          Table 1  Hemorrhage Control Results by Windlass or    loss was measured as volume per time, the windlass
          No Windlass                                        tests bled at an average of 6.7mL/s (95% CI, 6.5mL/
                                                             s–6.9mL/s) until bleeding was stopped, while the tests
                       Failed Hemorrhage Control             without a windlass bled at an average of 7.1mL/s (95%
           Windlass                Adjusted Wald   Total     CI, 6.9mL/s–7.3mL/s) throughout the test period.
           Used      Tests, No. (%)   95% CI     Tests, No.
           No          79 (99)      93%–100%        80       The Role of the User
           Yes         26 (32)       23%–43%        80       There were interesting results that varied by user. Even
                                                             with the user effect taken into account in the statistical
          Note: CI, confidence interval.
                                                             methods, there was a very significant windlass use ef-
          Pulse results were nearly the same as the hemorrhage   fect. For both users, the results of tests with no windlass
          control results in that the windlass played a major role   were similar in that almost every test failed. However,
          in improvised tourniquet performance (Table 2). In tests   tests with a windlass varied by user.
          with no windlass, attempts to stop the pulse failed  every
          time (80 of 80 tests, 100%; 95% CI, 96%–100%). With   The user with more experience had faster tests (mean
          a windlass, however, attempts to stop the pulse failed   time, 70 seconds vs. 87 seconds,  p < .0001; 95% CI
          31% (95% CI, 22%–42%) of the time (25 of 80 tests);   for difference, 6–27 seconds). With these shorter times
          the difference in proportions was significant (p < .0001).   to stop bleeding, the mean blood loss was also less for
          The similarity between results of pulse stoppage and   the user with more experience (mean volume, 458mL
          hemorrhage control indicated that the two phenomena   vs. 604mL; p < .0001; 95% CI for difference, 78mL–
          were closely related.                              213mL). However, the users differed greatly in pres-
                                                             sure. The mean pressure applied by the experienced user
          Time to Bleeding Cessation, Pressure,              was 15mmHg, while the less-experienced user applied
          and Blood-Loss Volume Results                      a mean pressure of 145mmHg (p < .0001; 95% CI for
          The mean time to bleeding cessation with no windlass   difference, 111mmHg–148mmHg). Based on these re-
          was 59 seconds (95% CI, 54–64 seconds), and all but   sults, we decided it was necessary to consider the user
          one test with no windlass ended in failure (79 of 80   a random effect in the mixed statistical modeling when
          tests; 95% CI, 93%–100%). On the other hand, the   comparing windlass type for the factors of interest: time
          mean time to bleeding cessation with a windlass was   to stop bleeding, pressure, blood loss, and blood loss
          98 seconds (95% CI, 90–105 seconds), and 32% (26 of   per second.
          80 tests; 95% CI, 23%–43%) of tests ended in failure.
          The difference in mean times was significant (p < .0001;   Discussion
          95% CI for difference, 28–48).
                                                             The first major finding of the present study is that the
          Table 2  Pulse Stoppage Results by Windlass or No Windlass  performance of improvised tourniquets varied by design,
                                                             with the strap-and-windlass method performing sub-
                         Failed Pulse Cessation              stantially better than the strap with no windlass. Tour-
           Windlass                Adjusted Wald   Total     niquets with a windlass had higher proportions of tests
           Used      Tests, No. (%)   95% CI     Tests, No.  with hemorrhage control, higher proportions of tests
           No          80 (100)     96%–100%        80       with suitable pressures, and lower rates of blood loss.
           Yes         25 (31)       22%–42%        80       Mean blood loss volumes with a windlass were more
                                                             because such tests were reliably effective and lasted lon-
           Total         105                        160
                                                             ger while tests with no windlass were not reliably effec-
          Note: CI, confidence interval.                     tive and ended earlier. Use of a windlass is historically
                                                             intended to gain a mechanical advantage in tightening a
          The mean pressure applied with no windlass was 46mmHg   tourniquet. As a matter of fact, this windlass role is not
          (95% CI, 35mmHg–58mmHg), whereas with a windlass,    specific to tourniquets but applies to hauling and lifting


          44                                    Journal of Special Operations Medicine  Volume 15, Edition 2/Summer 2015