
Page 40 - Journal of Special Operations Medicine - Summer 2014
P. 40
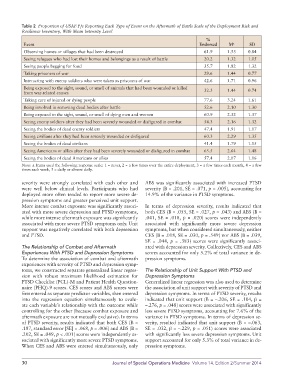
Table 2  Proportion of USAF PJs Reporting Each Type of Event on the Aftermath of Battle Scale of the Deployment Risk and
          Resilience Inventory, With Mean Intensity Level

                                                                                      %
           Event                                                                   Endorsed    M a      SD
           Observing homes or villages that had been destroyed                       61.9      1.53    0.84
           Seeing refugees who had lost their homes and belongings as a result of battle  20.2  1.32   1.05
           Seeing people begging for food                                            35.7      1.82    1.32
           Taking prisoners of war                                                   29.6      1.44    0.77
           Interacting with enemy soldiers who were taken as prisoners of war        42.6      1.71    0.96
           Being exposed to the sight, sound, or smell of animals that had been wounded or killed   32.3  1.44  0.74
           from war-related causes
           Taking care of injured or dying people                                    77.6      3.24    1.61
           Being involved in removing dead bodies after battle                       52.6      2.10    1.30
           Being exposed to the sight, sound, or smell of dying men and women        60.9      2.32    1.37
           Seeing enemy soldiers after they had been severely wounded or disfigured in combat  54.3  2.16  1.32
           Seeing the bodies of dead enemy soldiers                                  47.4      1.91    1.17
           Seeing civilians after they had been severely wounded or disfigured       60.3      2.29    1.35
           Seeing the bodies of dead civilians                                       41.4      1.79    1.15
           Seeing Americans or allies after they had been severely wounded or disfigured in combat  65.5  2.64  1.48
           Seeing the bodies of dead Americans or allies                             57.4      2.07    1.16
          Note: a. Items used the following response scale: 1 = never, 2 = a few times over the entire deployment, 3 = a few times each month, 4 = a few

          times each week, 5 = daily or almost daily.
          severity  were  strongly  correlated  with  each  other  and   ABS was significantly associated with increased PTSD
          were well below clinical levels. Participants who had   severity (B = .201, SE = .071, p = .005), accounting for
          deployed more often tended to report more severe de-  14.9% of the variance in PTSD symptoms.
          pression symptoms and greater perceived unit support.
          More intense combat exposure was significantly associ-  In terms  of depression  severity, results  indicated that
          ated with more severe depression and PTSD symptoms,   both CES (B = .055, SE = .027, p = .043) and ABS (B =
          while more intense aftermath exposure was significantly   .041, SE = .018, p = .020) scores were independently
          associated with more severe PTSD symptoms only. Unit   associated with significantly more severe depression
          support was negatively correlated with both depression   symptoms, but when considered simultaneously, neither
          and PTSD.                                          CES (B = .018, SE = .030, p = .549) nor ABS (B = .039,
                                                             SE = .044,  p = .383) scores were significantly associ-
          The Relationship of Combat and Aftermath           ated with depression severity. Collectively, CES and ABS
          Experiences With PTSD and Depression Symptoms      scores accounted for only 5.2% of total variance in de-
          To determine the association of combat and aftermath   pression symptoms.
          experiences with severity of PTSD and depression symp-
          toms, we constructed separate generalized linear regres-  The Relationship of Unit Support With PTSD and
          sion with robust maximum likelihood estimation for   Depression Symptoms
          PTSD Checklist (PCL)-M and Patient Health Question-  Generalized linear regression was also used to determine
          naire (PHQ)-9 scores. CES scores and ABS scores were   the association of unit support with severity of PTSD and
          first entered as separate predictor variables, then entered   depression symptoms. In terms of PTSD severity, results
          into the regression equation simultaneously to evalu-  indicated that unit support (B = –.206, SE = .104, β =
          ate each variable’s relationship with the outcome while   –.276, p = .048) scores were associated with significantly
            controlling for the other (because combat exposure and   less severe PTSD symptoms, accounting for 7.6% of the
          aftermath exposure are not mutually exclusive). In terms   variance in PTSD symptoms. In terms of depression se-
          of PTSD severity, results indicated that both CES (B =   verity, resulted indicated that unit support (B = –.063,
          .187, standard error [SE] = .068, p = .006) and ABS (B =   SE = .032, β = –.229, p = .051) scores were associated
          .202, SE = .049, p < .001) scores were independently as-  with significantly less severe depression symptoms. Unit
          sociated with significantly more severe PTSD symptoms.   support accounted for only 5.3% of total variance in de-
          When CES and ABS were entered simultaneously, only   pression symptoms.


          30                                   Journal of Special Operations Medicine  Volume 14, Edition 2/Summer 2014