
Page 57 - JSOM Spring 2026
P. 57
position was again assumed, the weapon was aligned with the Alpha levels were set at .05 a priori, except in the backward
target, followed by a final sprint 20m back to the start line to stepwise linear regression modelling, where potential predictor
finish the course. variables were retained in the model at each step if the asso-
ciated p value indicating their significance as a predictor was
If the officers voluntarily stopped, fell, or if the instructor less than an alpha level of .1. This approach for the regression
ceased for safety concerns, the test was stopped and restarted modelling ensured that potential predictors were not removed
a minimum of three minutes later. Completion time was re- prematurely in the steps of the regression modelling.
corded (min and s) using a stopwatch and paper recording
sheets. The officers were all familiar with the test and per- Results
formed the complete test once as fast as possible.
All candidates and PTG officers completed the RUSH, with
Each officer was dressed based on the role and scope of their no dropouts. The mean cohort RUSH time, across all par-
PTG unit. The load for each participant was based on the unit’s ticipants (n=52; composed of 34 PTG officers and 18 can-
jurisdictional ‘high-level’ load-out requirement. Prior to the didates) was 107.7 (SD 13.1) s, (1:48 [SD 0:13] min:s), and
testing, officers underwent a formal warm-up and equipment PPE weight was 22.2 (SD 4.9) kg . While no significant dif-
check as per their role. The candidates (being unqualified PTG ferences in mean height, body weight, or BMI were observed
officers) lacked personal issue PTG PPE; thus, the researchers between PTG officers and candidates, there were significant
issued equipment and standard ballistic vests similar to those differences between these groups, assessing the mean age be-
worn in the candidates’ general duties role. tween groups (t =–3.19, P=.002) and PPE weight (t4 0.01 =23.4,
50
P<.001, unequal variances) (Table 1). There was no significant
Statistical Analysis difference in mean RUSH time between PTG officers (105.1
Statistical power analyses indicated that a sample size of 49 [SD 14.5] s) and candidates (111.7 [SD 9.2] s, t =1.622,
50
participants was sufficient to enable detection of correlations P=.056).
between age and RUSH time that exceeded 0.39 (a weak level
of correlation—see below) with 80% power, assuming an al- The results of the correlation analyses indicated that the re-
pha level of 0.05. Thus, it is likely the final sample size of 52 lationships between RUSH time and weight carried (r=0.235,
was sufficient to identify any relationship between age and P=.094) and between RUSH time and age (r=0.097, P=.493)
RUSH time that was more than weak. were weak and non-significant.
Initially, the data was documented in a Microsoft Excel spread- The results of the backward stepwise regression modelling were
sheet. The data were then imported into IBM Statistical Pack- consistent with these correlation findings and indicated that
age for Social Sciences (SPSS) Statistics software (IBM Corp, neither age nor group was a statistically significant predictor of
Armonk, NY) for analysis, and time was converted from min:s RUSH time, and that weight carried was not significantly pre-
to s. After descriptive analysis, independent-samples t tests dictive of RUSH time when entered alone in a regression model.
were performed to determine whether there were significant Specifically, following entry of all three potential predictors in
differences in completion times between candidates and PTG the first step of the regression modelling, group was removed
officers. A Pearson’s correlation was conducted to investigate as a predictor in the second model (F change1,48 =0.094, P=.760)
the relationships between key variables (RUSH time, age, PPE and age (b=0.444, t =1.527, P=.133 in the second model) was
48
mass). removed in the third model (F change1,49 =2.331, P=.133). This left
only weight carried as a predictor in that third model, though
A backward stepwise linear regression was performed to iden- non-significant (b=0.630, t =1.708, P=.094).
49
tify which, if any, variables (qualification status, age, PPE mass)
were predictive of RUSH times. One variable was removed In the second model, weight carried (but not age) was iden-
from the regression model at each step based on it being the tified as a significant predictor of RUSH time (b=0.869,
least significant predictor in the preceding model, and if the t =2.194, P=.033) when age was included in the model but
51
associated P value indicating its level of statistical significance the overall second model (including both weight carried and
as a predictor was greater than or equal to 0.1. At the final age as predictor variables) did not reach statistical significance
model, only predictors with a P value less than 0.1 remained (F 1,50 =2.9, P=.094) and explained only 6.1% of the variability
in the predictive model. Strengths of correlations were consid- in RUSH times. As noted above, weight carried was not pre-
ered to be very weak (r=0–0.19), weak (0.2–0.39), moderate dictive of RUSH time when remaining as the sole predictor in
(0.4–0.69), strong (0.7–0.89), or very strong (0.9–1.0) using the third model, with that final model explaining only 3.6% of
the criteria specified by Fowler et al. the variability in RUSH times.
24
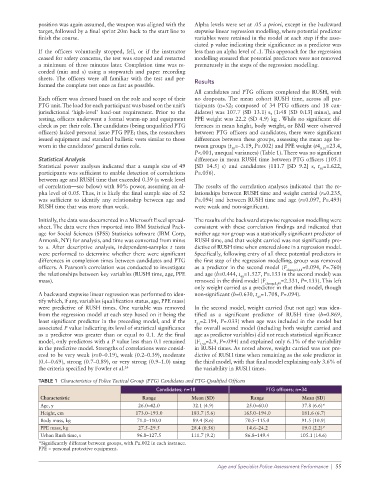
TABLE 1 Characteristics of Police Tactical Group (PTG) Candidates and PTG-Qualified Officers
Candidates; n=18 PTG officers; n=34
Characteristic Range Mean (SD) Range Mean (SD)
Age, y 26.0–42.0 32.1 (4.9) 25.0–60.0 37.8 (6.6)*
Height, cm 173.0–193.0 183.7 (5.6) 165.0–194.0 181.6 (6.7)
Body mass, kg 71.0–110.0 89.4 (8.6) 70.5–115.0 91.5 (10.9)
PPE mass, kg 27.5–29.5 28.4 (0.56) 14.6–24.2 19.0 (2.2)*
Urban Rush time, s 96.8–127.5 111.7 (9.2) 86.8–149.4 105.1 (14.6)
*Significantly different between groups, with P≤.002 in each instance.
PPE = personal protective equipment.
Age and Specialist Police Assessment Performance | 55