
Page 79 - JSOM Summer 2018
P. 79
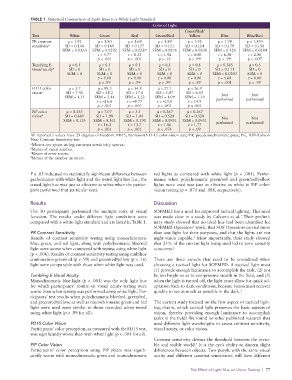
TABLE 1  Statistical Comparison of Light Hues to a White Light Standard
                                                                Color of Light
                                                                             Green/Red/
              Test            White       Green        Red       Green/Red     Yellow       Blue       Blue/Red
              PR contrast    μ = 1.92    μ = 1.80     μ = 1.69    μ = 1.89     μ = 1.92    μ = 1.74    μ = 1.835
              sensitivity a  SD = 0.144  SD = 0.160  SD = 0.157  SD = 0.151   SD = 0.114  SD = 0.179  SD = 0.156
                           SEM = 0.0263  SEM = 0.0292  SEM = 0.0287  SEM = 0.0276  SEM = 0.0208  SEM = 0.326  SEM = 0.0284
                                          t = 5.77    t = 8.33    t = 1.42     t = 0.00    t = 6.38     t = 2.96
                                         p < .001     p < .001     p > .16     p > .99     p > .99     p < .007
              Tumbling E     μ = 0.5      μ = 0.5     μ = 0.5      μ = 0.5     μ = 0.5     μ = 0.385    μ = 0.5
              visual acuity b  SD = 0     SD = 0      SD = 0       SD = 0      SD = 0     SD = 0.111    SD = 0
                             SEM = 0     SEM = 0      SEM = 0     SEM = 0     SEM = 0    SEM = 0.0203  SEM = 0
                                          t = 0.00    t = 0.00    t = 0.00     t = 0.00    t = 5.68     t = 0.00
                                          p > .99     p > .99      p > .99     p > .99     p < .001     p > .99
              FD15 color     μ = 3.7     μ = 88.3     μ = 34.8    μ = 27.1     μ = 26.9
              vision c      SD = 7.42    SD = 28.2   SD = 17.6    SD = 5.97   SD = 6.03
                            SEM = 1.35  SEM = 5.14   SEM = 3.22  SEM = 1.09  SEM = 1.10     Not          Not
                                         t = –16.8    t = –8.77   t = –15.0    t = 14.9   performed    performed
                                         p < .001     p > .001    p > .001     p ≤ .001
              PiP color      μ = 0.533   μ = 7.07     μ = 3.5     μ = 0.267   μ = 0.267
              vision d      SD = 0.681   SD = 1.98   SD = 1.04   SD = 0.520   SD = 0.520
                           SEM = 0.124  SEM = 0.361  SEM = 0.190  SEM = 0.0951  SEM = 0.0951  Not        Not
                                          t = 16.2    t = 13.7    t = 1.86     t = 1.77   performed    performed
                                         p < .001     p < .001    p < .074     p < .09
              All reported t values have 29 degrees of freedom. FD15, Farnsworth D-15 color-vision test; PiP, pseudoisochromatic plate; PR, Pelli-Robson
              Near Contrast Sensitivity test.
              a Means are given as log contrast sensitivity scores.
              b Means of visual acuities.
              c Means of error scores.
              d Means of the number incorrect.


              P ≥ .05 indicated no statistically significant difference between   red lights as compared with white light (p < .001). Perfor-
              performance with white light and the tested light hue (i.e., the   mance when polychromatic green/red and green/red/yellow
              tested light hue was just as effective as white when the partici-  lights were used was just as effective as white in PiP color-
              pant performed that particular test).              vision testing (p = .073 and .088, respectively).


              Results                                            Discussion
              The 30 participants performed the multiple tests of visual   SOFMED has a need for improved tactical lighting. This need
              function. The results under different light conditions were   was made clear in a study by Calvano et al.  Their prelimi-
                                                                                                    1
              compared with a white-light standard and are listed in Table 1.  nary study showed that no ideal hue had been identified for
                                                                 SOFMED Operators’ work, that SOF Operators carried more
              PR Contrast Sensitivity                            than one light for their purposes, and that the lights are not
              Results of contrast sensitivity testing using monochromatic   night-vision capable.  Most importantly, their study showed
                                                                                 1
              blue, green, and red light, along with polychromatic blue/red   that 25% of the current light being used led to poor casualty
              light were worse when compared with testing using white light   outcomes. 1
              (p < .006). Results of contrast sensitivity testing using multihue
              combination green/red (p > .99) and green/red/yellow (p > .16)   There are three aspects that need to be considered when
              light were comparable with those when white light was used.  choosing a tactical light for SOFMED. A tactical light must
                                                                 (1) provide enough luminance to accomplish the task, (2) not
              Tumbling E Visual Acuity                           be too bright so as to compromise stealth in the field, and (3)
              Monochromatic blue light (p < .001) was the only light hue   when the light is turned off, the light must allow for quick ad-
              for which participants’ results on visual acuity testing were   aptation back to dark conditions, because vision must recover
              worse than when testing was performed using white light. Par-  quickly to see as much as possible in the dark. 2
              ticipants’ test results when polychromatic blue/red, green/red,
              and green/red/yellow, as well as monochromatic green and red   The current study focused on the first aspect of tactical light-
              light were used were similar to those recorded when tested   ing, that is, which tactical light preserves the basic aspects of
              using white light (p > .99 for all).               vision, thereby providing enough luminance to accomplish
                                                                 tasks in the field? We found no other published research that
              FD15 Color Vision                                  used different light wavelengths to assess contrast sensitivity,
              Participants’ color perception, as measured with the FD15 test,   visual acuity, or color vision.
              was significantly worse than with white light (p < .001 for all).
                                                                 Contrast sensitivity defines the threshold between the invisi-
                                                                                  3
              PiP Color Vision                                   ble and visible world.  It is the eye’s ability to discern slight
              Participants’ color perception using PiP plates was signifi-  differences between objects. Two people with the same visual
              cantly worse with monochromatic green and monochromatic   acuity and different contrast sensitivities will have different

                                                                               The Effect of Light Hue on Vision Testing  |  77