
Page 90 - JSOM Winter 2024
P. 90
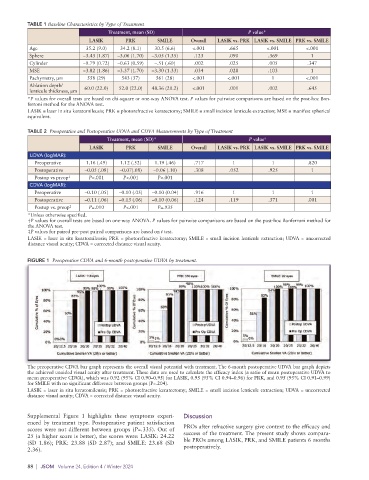
TABLE 1 Baseline Characteristics by Type of Treatment
                                    Treatment, mean (SD)                          P value*
                              LASIK       PRK       SMILE      Overall  LASIK vs. PRK LASIK vs. SMILE PRK vs. SMILE
           Age               35.2 (9.0)  34.2 (8.1)  30.5 (6.6)  <.001      .665        <.001        <.001
           Sphere           –3.43 (1.87)  –3.06 (1.70)  –3.05 (1.35)  .123  .090         .369          1
           Cylinder         –0.79 (0.72)  –0.63 (0.59)  –.51 (.60)  .002    .025         .005        .347
           MSE              –3.82 (1.86)  –3.37 (1.70)  –3.30 (1.33)  .034  .028         .103          1
           Pachymetry, µm     558 (29)   543 (37)   561 (28)    <.001      <.001          1          <.001
           Ablation depth/
           lenticule thickness, µm  60.0 (22.0)  52.0 (22.0)  48.36 (20.2)  <.001  .001  .002        .645
          *P values for overall tests are based on chi-square or one-way ANOVA test. P values for pairwise comparisons are based on the post-hoc Bon-
          ferroni method for the ANOVA test.
          LASIK = laser in situ keratomileusis; PRK = photorefractive keratectomy; SMILE = small incision lenticule extraction; MSE = manifest spherical
          equivalent.

          TABLE 2  Preoperative and Postoperative UDVA and CDVA Measurements by Type of Treatment
                                    Treatment, mean (SD)*                         P value †
                              LASIK       PRK        SMILE     Overall  LASIK vs. PRK LASIK vs. SMILE PRK vs. SMILE
           UDVA (logMAR):
             Preoperative    1.16 (.49)  1.12 (.52)  1.19 (.46)  .717        1            1           .820
             Postoperative   –0.05 (.08)  –0.07(.08)  –0.06 (.10)  .308     .052         .925          1
             Postop vs preop ‡  P<.001   P<.001      P<.001
           CDVA (logMAR):
             Preoperative    –0.10 (.05)  –0.10 (.05)  –0.10 (0.04)  .916    1            1            1
             Postoperative   –0.11 (.06)  –0.13 (.06)  –0.10 (0.06)  .124   .119         .371         .001
             Postop vs. preop ‡  P=.010  P<.001      P=.935
          *Unless otherwise specified.
          †P values for overall tests are based on one-way ANOVA. P values for pairwise comparisons are based on the post-hoc Bonferroni method for
          the ANOVA test.
          ‡P values for paired pre-post paired comparisons are based on t test.
          LASIK = laser in situ keratomileusis; PRK = photorefractive keratectomy; SMILE = small incision lenticule extraction; UDVA = uncorrected
          distance visual acuity; CDVA = corrected distance visual acuity.

          FIGURE 1  Preoperative CDVA and 6-month postoperative UDVA by treatment.


          The preoperative CDVA bar graph represents the overall visual potential with treatment. The 6-month postoperative UDVA bar graph depicts
          the achieved unaided visual acuity after treatment. These data are used to calculate the efficacy index (a ratio of mean postoperative UDVA to
          mean preoperative CDVA), which was 0.92 (95% CI 0.90–0.95) for LASIK, 0.95 (95% CI 0.94–0.96) for PRK, and 0.95 (95% CI 0.91–0.99)
          for SMILE with no significant difference between groups (P=.204).
          LASIK = laser in situ keratomileusis; PRK = photorefractive keratectomy; SMILE = small incision lenticule extraction; UDVA = uncorrected
          distance visual acuity; CDVA = corrected distance visual acuity.


          Supplemental  Figure  1  highlights  these  symptoms  experi-  Discussion
          enced by treatment type. Postoperative patient satisfaction
          scores were not different between groups (P=.335). Out of     PROs after refractive surgery give context to the efficacy and
          25 (a higher score is better), the scores were: LASIK: 24.22   success of the treatment. The present study shows compara-
          (SD  1.86);  PRK:  23.88 (SD  2.87);  and  SMILE: 23.68  (SD   ble PROs among LASIK, PRK, and SMILE patients 6 months
          2.36).                                             postoperatively.

          88  |  JSOM   Volume 24, Edition 4 / Winter 2024