
Page 52 - JSOM Spring 2024
P. 52
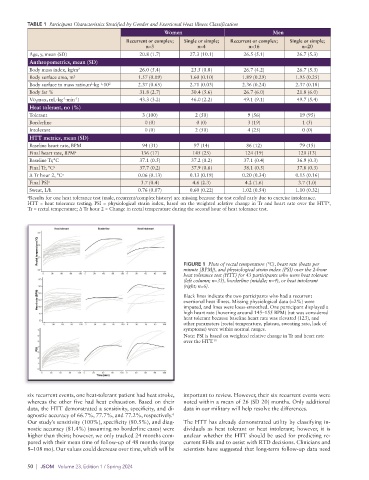
TABLE 1  Participant Characteristics Stratified by Gender and Exertional Heat Illness Classification
                                                       Women                              Men
                                          Recurrent or complex;   Single or simple;   Recurrent or complex;   Single or simple;
                                                 n=3              n=4             n=16              n=20
           Age, y, mean (SD)                   20.8 (1.7)      27.3 (10.1)       26.5 (5.1)       26.7 (5.3)
           Anthropometrics, mean (SD)
           Body mass index, kg/m 2             26.0 (5.4)      23.5 (0.8)        26.7 (4.2)       26.7 (5.3)
           Body surface area, m 2             1.57 (0.09)      1.60 (0.10)      1.89 (0.29)       1.95 (0.25)
           Body surface to mass ratio,m ·kg ·10 2  2.37 (0.65)  2.71 (0.03)     2.36 (0.24)       2.37 (0.18)
                                 −1
                               2
           Body fat %                          31.8 (2.7)      30.4 (5.6)        26.7 (6.0)       21.8 (6.0)
           Vo 2 max, mL·kg ·min )              43.3 (3.2)      46.0 (2.2)        49.1 (9.1)       49.7 (5.4)
                      -1
                         -1
           Heat tolerant, no (%)
           Tolerant                            3 (100)           2 (50)           9 (56)           19 (95)
           Borderline                           0 (0)            0 (0)            3 (19)            1 (5)
           Intolerant                           0 (0)            2 (50)           4 (25)            0 (0)
           HTT metrics, mean (SD)
           Baseline heart rate, BPM            94 (31)          97 (14)           86 (12)          79 (15)
           Final heart rate, BPM a             136 (17)         145 (25)         124 (19)         120 (13)
           Baseline Tr,°C                      37.1 (0.5)      37.2 (0.2)        37.1 (0.4)       36.9 (0.3)
           Final Tr, °C a                      37.7 (0.2)      37.9 (0.6)        38.1 (0.5)       37.8 (0.3)
           Δ Tr hour 2, °C a                  0.06 (0.13)      0.13 (0.18)      0.20 (0.34)       0.15 (0.16)
           Final PSI a                         3.7 (0.4)        4.6 (2.3)        4.2 (1.6)        3.7 (1.0)
           Sweat, L/h                         0.76 (0.07)      0.60 (0.22)      1.02 (0.54)       1.10 (0.32)
          a Results for one heat tolerance test (male, recurrent/complex history) are missing because the test ended early due to exercise intolerance.
                                                                                                            6
          HTT = heat tolerance testing; PSI = physiological strain index, based on the weighted relative change in Tr and heart rate over the HTT ,
          Tr = rectal temperature; Δ Tr hour 2 = Change in rectal temperature during the second hour of heat tolerance test.


                                                             FIGURE 1  Plots of rectal temperature (°C), heart rate (beats per
                                                             minute [BPM]), and physiological strain index (PSI) over the 2-hour
                                                             heat tolerance test (HTT) for 43 participants who were heat tolerant
                                                             (left column; n=33), borderline (middle; n=4), or heat intolerant
                                                             (right; n=6).
                                                             Black lines indicate the two  participants who had a recurrent
                                                               exertional heat illness. Missing physiological data (<2%) were
                                                               imputed, and lines were loess-smoothed. One participant  displayed a
                                                             high heart rate (hovering around 145–155 BPM) but was considered
                                                             heat tolerant because baseline heart rate was  elevated (123), and
                                                             other parameters (rectal temperature, plateau, sweating rate, lack of
                                                             symptoms) were within normal ranges.
                                                             Note: PSI is based on weighted relative change in Tr and heart rate
                                                             over the HTT. 15


          six recurrent events, one heat-tolerant patient had heat stroke,   important to review. However, their six recurrent events were
          whereas the other five had heat exhaustion. Based on their   noted within a mean of 26 (SD 20) months. Only additional
          data, the HTT demonstrated a sensitivity, specificity, and di-  data in our military will help resolve the differences.
                                                         6
          agnostic accuracy of 66.7%, 77.7%, and 77.2%, respectively.
          Our study’s sensitivity (100%), specificity (80.5%), and diag-  The HTT has already demonstrated utility by classifying in-
          nostic accuracy (81.4%) (assuming no borderline cases) were   dividuals as heat tolerant or heat intolerant; however, it is
          higher than theirs; however, we only tracked 24 months com-  unclear whether the HTT should be used for predicting re-
          pared with their mean time of follow-up of 48 months (range   current EHIs and to assist with RTD decisions. Clinicians and
          8–108 mo). Our values could decrease over time, which will be   scientists have suggested that long-term follow-up data need

          50  |  JSOM   Volume 23, Edition 1 / Spring 2024